


(Belinda Jiao/Getty Images)


Within minutes of an election being called yesterday, the question on every broadcaster’s lips wasn’t whether the Conservative Party would lose in July — but how damaging the margin will be.
Labour’s current lead has a very wide range among pollsters, from 15 points (J.L. Partners) to 27 (YouGov). And yet, this does not tell the entire story: at the local elections, the BBC’s Projected National Vote (PNV) share pointed towards a single-figure lead for Keir Starmer’s party. So, as we stare down the barrel of a new election campaign, what explains these large gaps — and what is Labour’s “true” lead?
To answer this, Focaldata used this month’s local elections to project a general election result. And our findings may surprise you. They suggest that, for all the excitement emanating from Labour quarters yesterday, their popular vote is much lower than national polling estimates. However, thanks in large part to the efficient nature of the party’s current vote distribution, we believe Labour is still on course for a large parliamentary majority: we estimate that Labour needs a 5-7% vote-share lead to win, the lowest the party has needed to clear since 2010.
What is Labour’s “true” lead?
In the recent local elections, Labour’s lead over the Conservatives in the PNV share was nine points, with Keir Starmer’s party on 34% and Rishi Sunak’s on 25%. This is a much smaller lead than estimated by national polls.
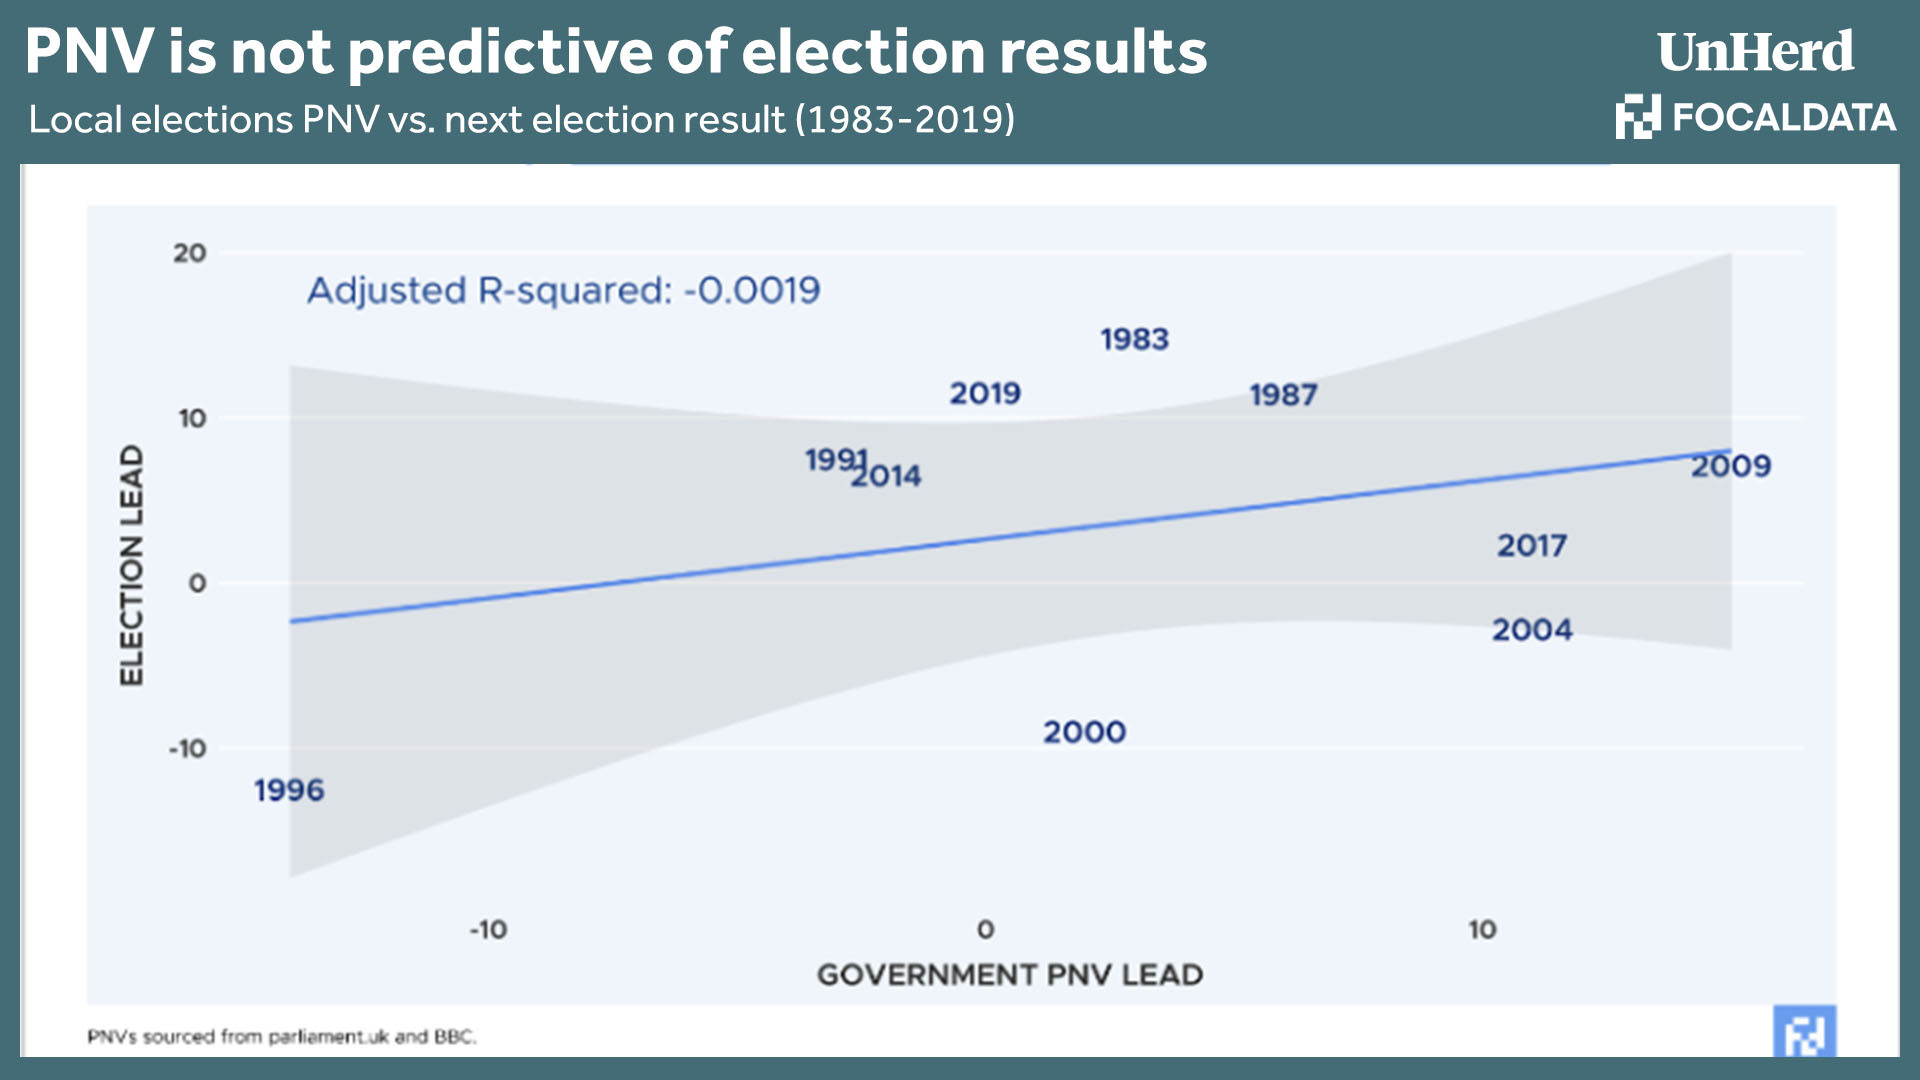
However, local election PNVs are not necessarily a useful metric for assessing how the country might vote in a general election. There is, history shows, very little relationship between the PNV in the set of local elections preceding a general election and the subsequent result. Our analysis of the past 10 general elections shows no provable relationship between local election PNV lead and final popular vote margin.
That being said, we think that the PNV is likely to be much closer to Labour’s “true” lead. National vote intention polls are “nowcasts” — glassy snapshots of current opinion — rather than forecasts of actual voting behaviour in a general election. Many assumptions that pollsters make to turn their polls into forecasts, including how they treat “don’t knows” and handle turnout effects, could be playing up Labour’s lead. In the month leading up to the local elections, for example, different pollster methodologies accounted for a full four percentage point difference in Labour’s vote share.
To better understand Labour’s “true” lead, FocalData, inspired by the work of Dylan Difford, compared the local election results to historic data on local-to-general election voting behaviour from the British Election Study. For the seats where we did not have a complete picture from the locals, we used the results from the latest public MRP polls.
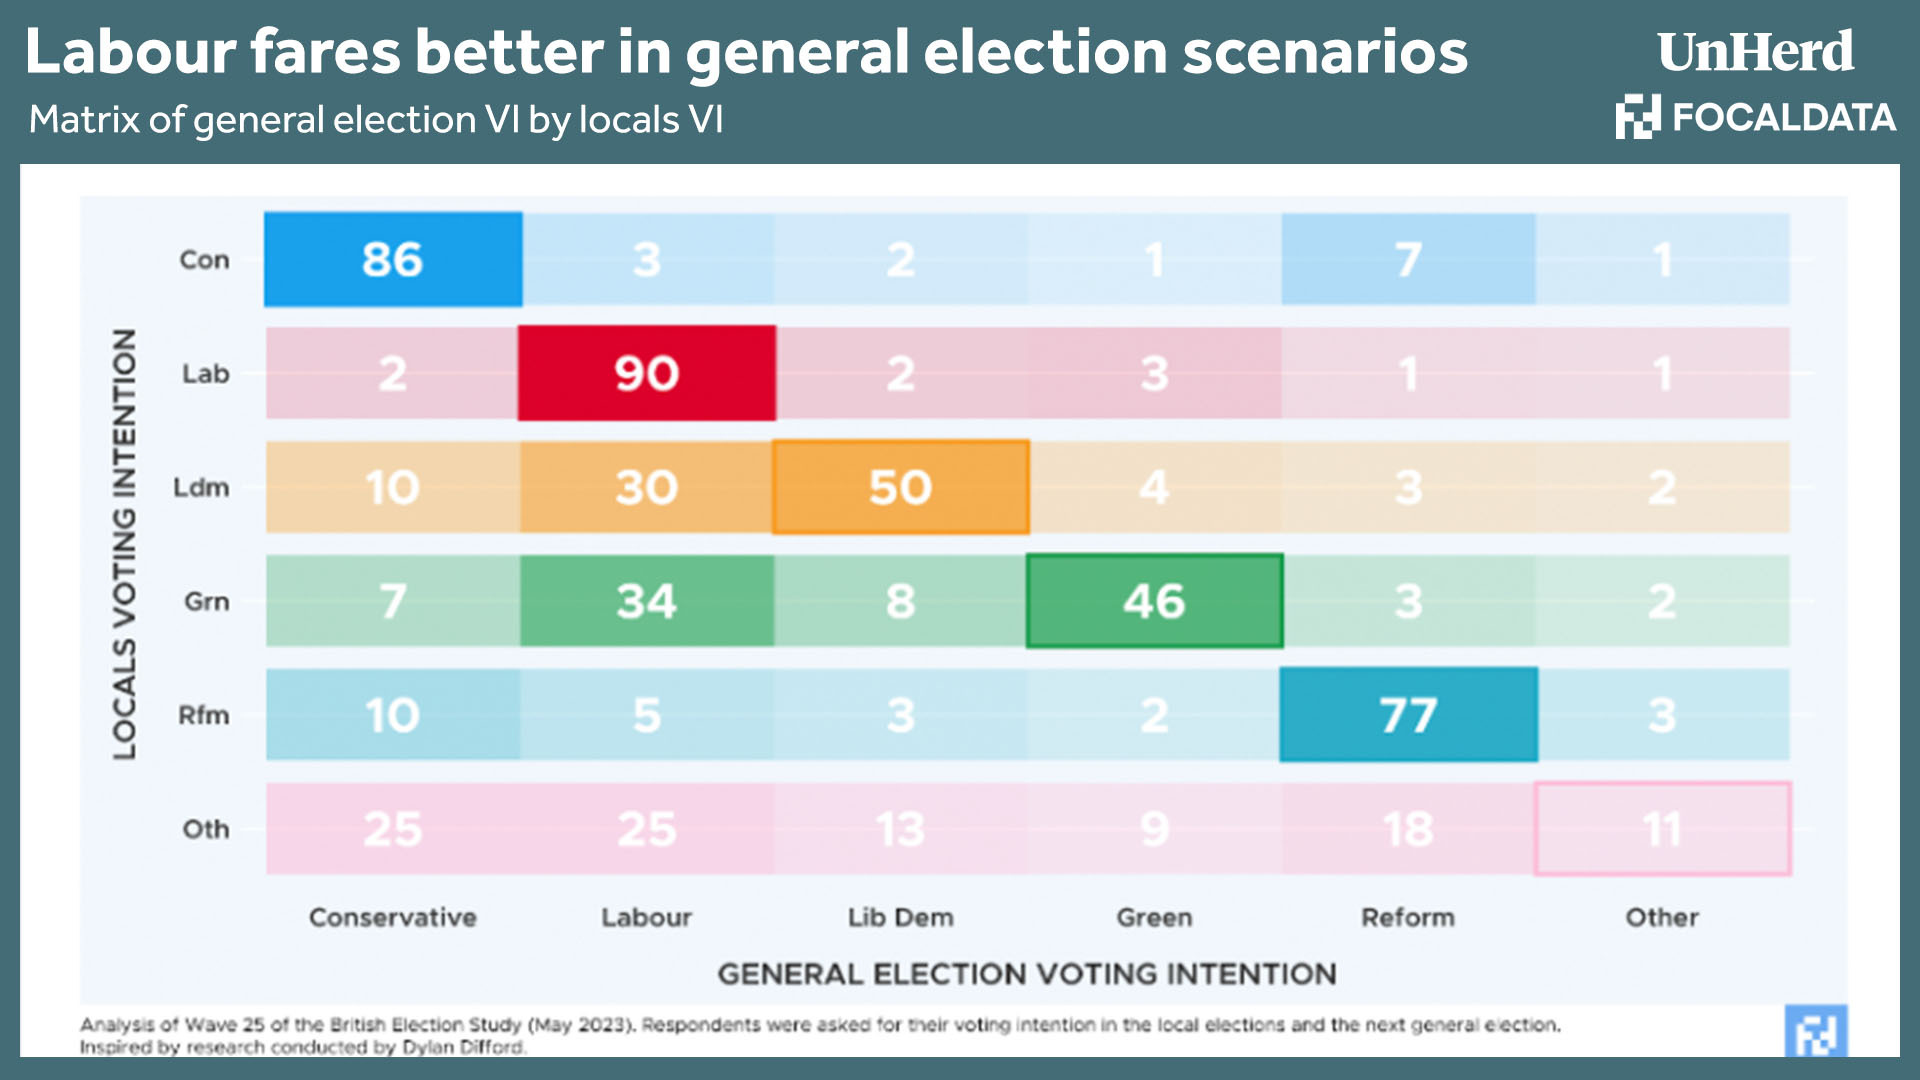
As you can see from the table above, a significant chunk of Liberal Democrat and Green local election voters said they intended to vote for Labour in a general election. We thus allocated 30% of Lib Dem voters and 34% of Greens to the Labour column in our projection.
This locals-to-general election transition model produced a Labour lead of 12 points in Great Britain, with the party on course for a majority of around 140 seats (394 seats for Labour vs 160 for the Conservatives). At the national level, our projection puts Labour on 38%, the Conservatives on 26%, the Lib Dems on 13%, Reform on 7% and the Greens on 5%.
The efficiency of Labour’s vote
The second important story that emerged from the local elections relates to vote efficiency: the likelihood of a supporter to actually vote. If we take our local-to-general election projection and group Conservative and Labour-held seats based on their partisanship compared to the national average, we find that the Conservative-to-Labour swing is much higher in Conservative-held seats. In other words, Labour are winning votes exactly in the places it needs to form a majority government.
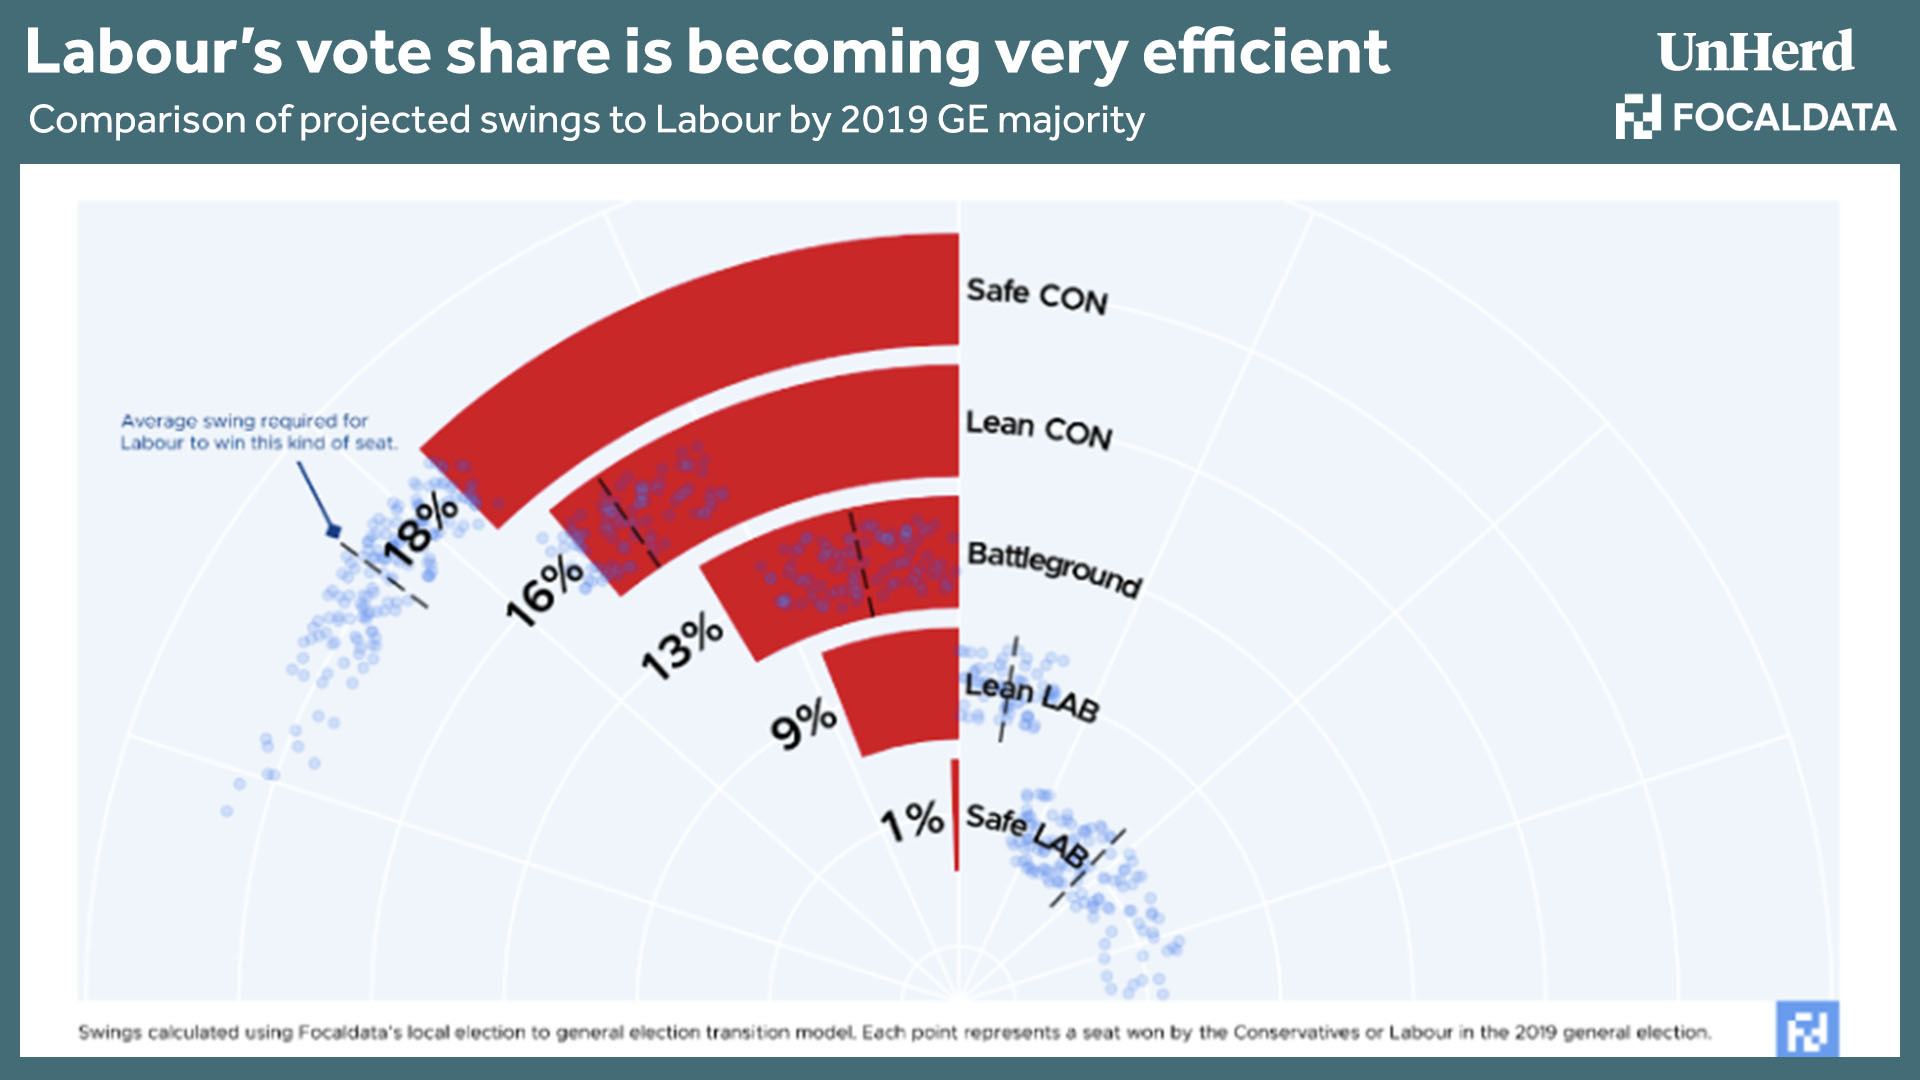
To examine vote efficiency in more detail, we started with Colin Rallings and Michael Thrasher’s estimates of the notional results for the 2019 general election on new constituency boundaries. To estimate the outcome if the national popular vote was tied between the two main parties, all seats not held by the Conservatives or Labour were removed and each constituency was adjusted via a uniform national swing. Seats with a more than 25-point gap between the two parties were designated as “safe” and those with a 10–25-point gap were designated as “lean”, with all others marked as battleground seats. As you can see below, Labour appears to be winning over voters exactly where it needs to, with proportionally larger swings projected in the safest Conservative seats.
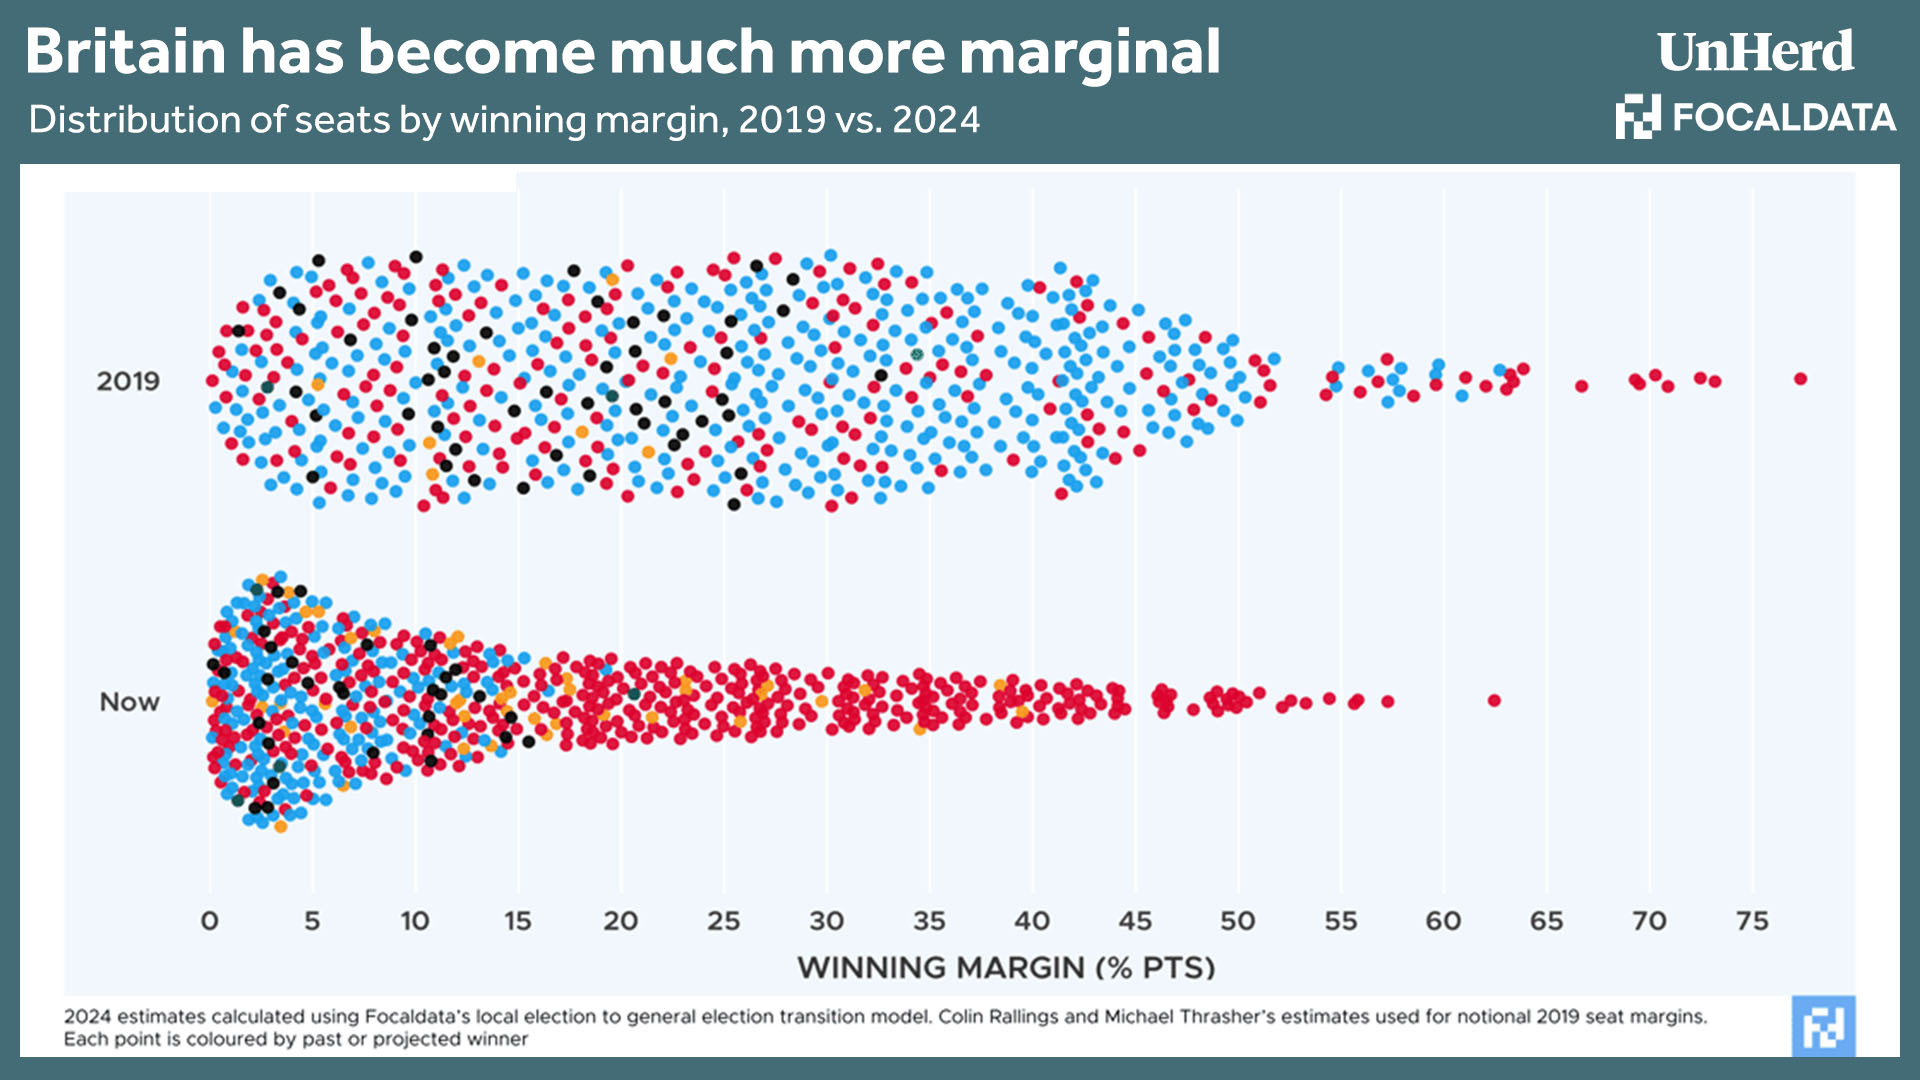
An important side effect of better-distributed voters will be a huge increase in the number of marginal seats at the next election. The chart below shows all seats ordered by marginality in 2019, along with our 2024 locals projection. The number of seats with a winning margin smaller than five points has more than trebled, from 56 in 2019 to an estimated 175 in 2024. While we expect some of this tight distribution to be an artifacts of MRP modelling, there is no doubt that this election will see seats in play that have not been in more than 20 years.
The implication of this is that any movement in the polls between now and the election is likely to have an outsized effect on the number of seats won by each party. While we project a sizeable majority for Labour, the window of possible outcomes is wide.
What does Labour’s lead need to be?
As a result of its increased vote efficiency, it seems unlikely Labour will need a double-figure popular-vote lead for a majority. Even so, the exact size of the necessary Conservative-Labour gap remains a point of disagreement among analysts and commentators — and with good cause. The popular-vote lead needed for a majority, for either party, has changed dramatically over the last 45 years.

So much could be written about the graph above. Looking at the 1992 election, Labour needed a popular-vote lead of only 0.6 points to govern (which is what the polls were showing), but the Conservatives needed a large 6.7-point voting gap. By contrast, in 2001, Labour could have governed the country with a majority despite being three points behind the Conservatives. The Blair years saw some of the most unequal, unrepresentative governments to have been elected in Britain, on increasingly depressed turnout levels.
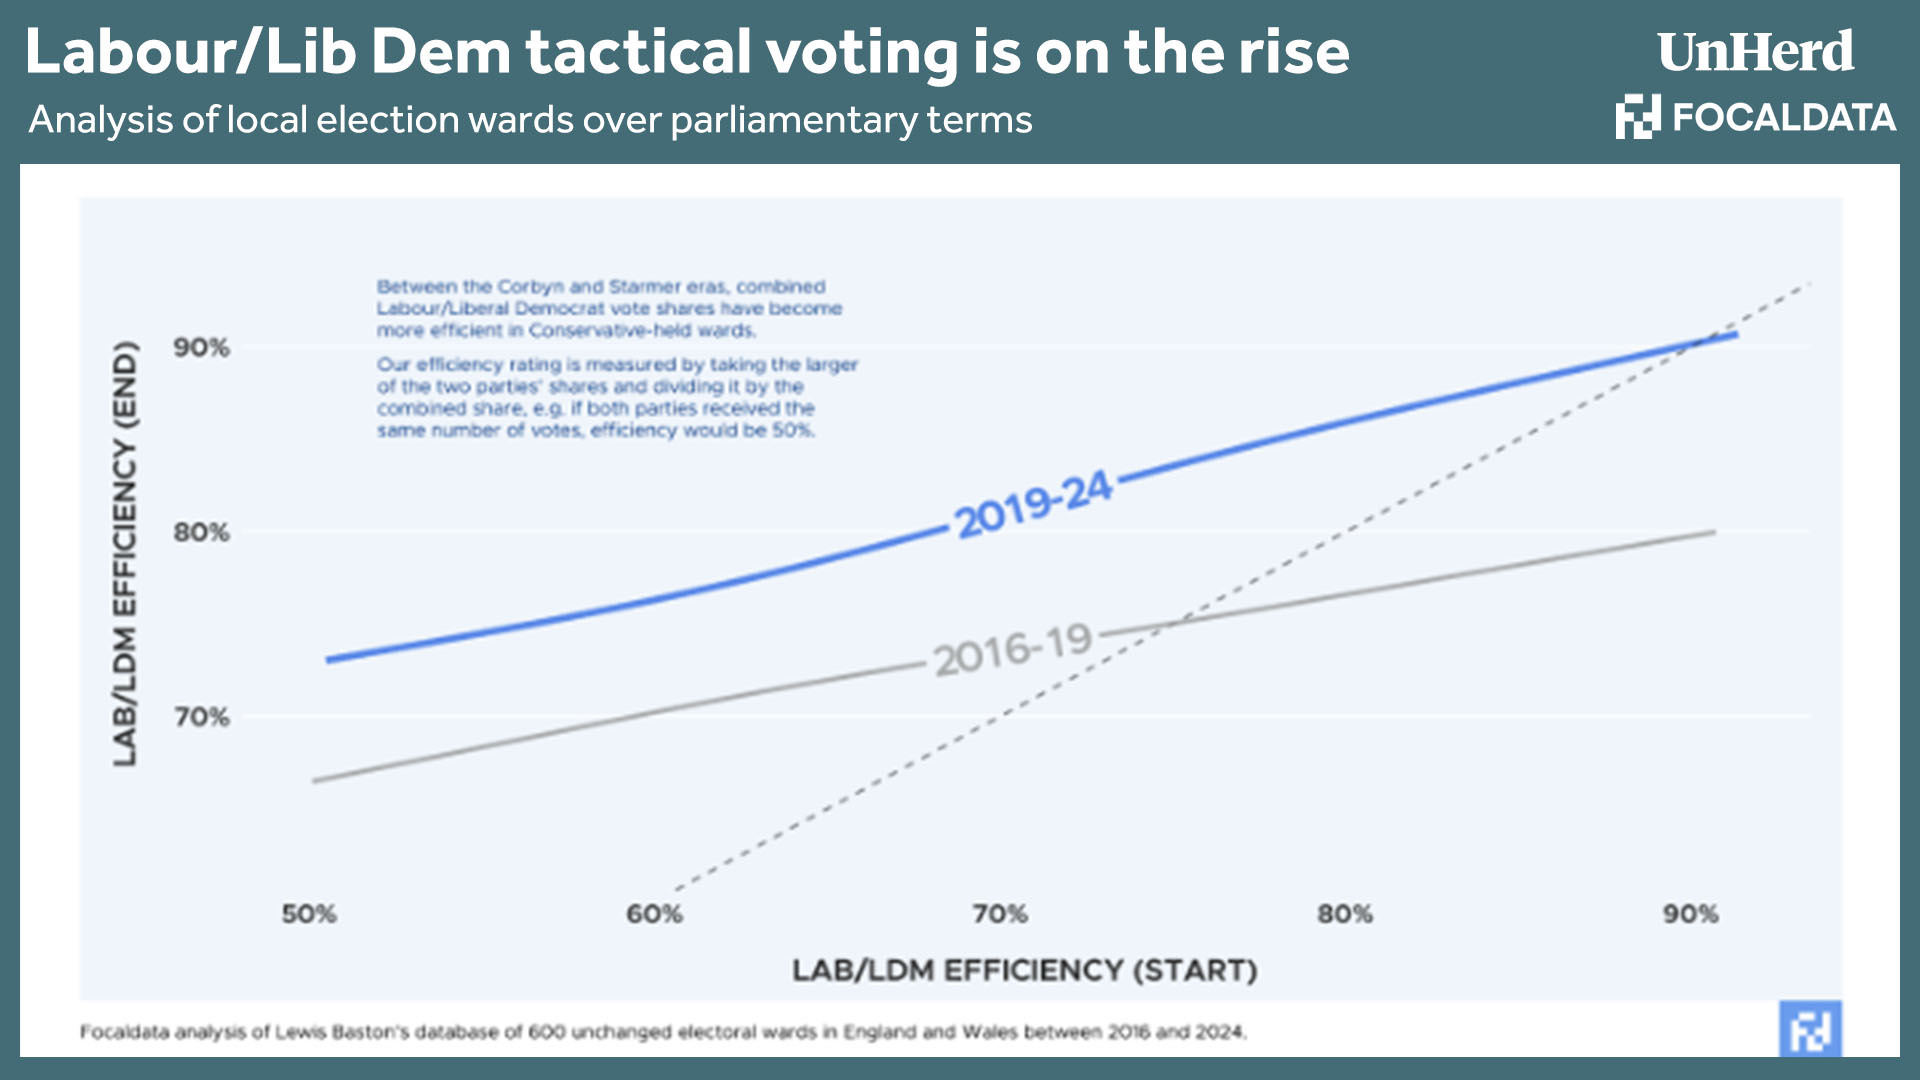
As for what it needs to be this time, there are a number of factors that benefit Labour: from their advantageous distribution in marginal seats to the likelihood of the Lib Dems taking seats off the Tories. In particular, tactical voting will be particularly significant: for there appears to be much more Labour/Liberal Democrat tactical voting under Starmer’s leadership than there was under Jeremy Corbyn. This is understandable when we consider that 2019 Lib Dem voters rated Starmer an average of 5.4 out of 10 in the most recent British Election Study survey, versus 2.6 for Corbyn — the highest gap between the two men of any party. In fact, 2019 Liberal Democrats are basically indistinguishable from 2019 Labour voters in their opinions on the current Labour leader (the latter rated Starmer an average of 5.5 out of 10).
How will this benefit Labour? The exhibit below shows the level of efficiency of the Labour/Liberal Democrat vote share. From our analysis, there is an increasing pattern of the two parties’ voters aligning themselves with the strongest anti-Conservative challenger in subsequent elections. This pattern has also emerged in by-elections over the course of this parliament, and would reduce Labour’s majority threshold even further if replicated at a general election.
And yet, despite this highly optimistic outlook for Labour, we must declare a word of warning: as mentioned, the window of probable electoral outcomes is large, and all the dynamics which are likely to propel Labour to a sizeable majority could become unstuck very quickly. Any combination of the Conservatives appealing to cultural Conservatives and older voters again, an SNP recovery, and southern free-market Liberal Democrat voters unable to cope with a period of high-tax Labour government, could cause significant problems for Keir Starmer. In today’s day and age, big majorities assembled at warp speed seem to look more like sandcastles than skyscrapers.
