


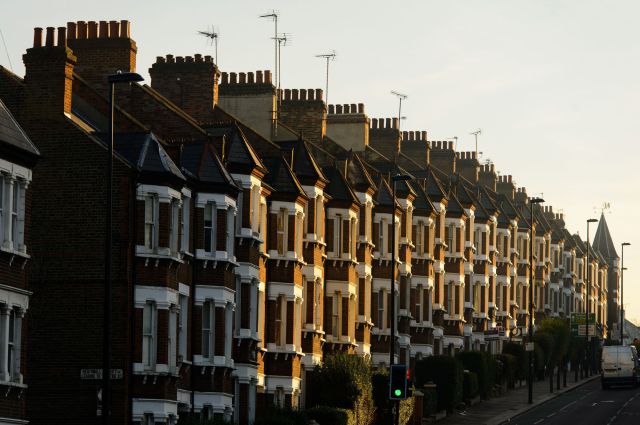
Credit: Dominic Lipinski/PA Wire/PA Images


Part one of “Home Truths”, Liam Halligan’s in-depth investigation of the UK housing crisis.
“The housing shortage isn’t a looming crisis, a distant threat that will become a problem if we fail to act. We’re already living in it”.[1. Fixing Our Broken Housing Market, Ministry for Housing, Communities and Local Government (MHCLG), February 2017, Cm 9352.]
Housing is increasingly unaffordable in many parts of the UK, with prices and rents rising much faster than earnings because far too few homes have been built. Since the 2008 financial crisis, the homes shortage has become more acute – sending affordability to the top of the political agenda.
The rate of house building has long lagged the UK’s natural population growth and net immigration. Since the mid-1980s, an estimated 2.3 million too few homes have been built.[2. Professor Paul Cheshire of the London School of Economics, quoted by Liam Halligan, ‘Home to Roost‘ The Spectator, 5 November 2016.] The seminal Barker Review of 2004 presented “considerable evidence” of a homes shortage, suggesting 245,000 new homes were needed each year to match household formation.[3. Kate Barker, Review of ‘House Supply – Delivering Stability: Securing our Future Housing Needs’ HM Treasury, 2004. Since Barker, two other “independent reviews” – have come to broadly similar conclusions regarding the UK’s shortage of homes. See John Callcutt, ‘The Callcutt Review of House-building Delivery’, Department for Communities and Local Government, 2007. And Michael Lyons, ‘The Lyons Review: Mobilizing across the nation to build the homes our children need’, 2014] For decades, building has fallen way short – as shown in Graph 1.
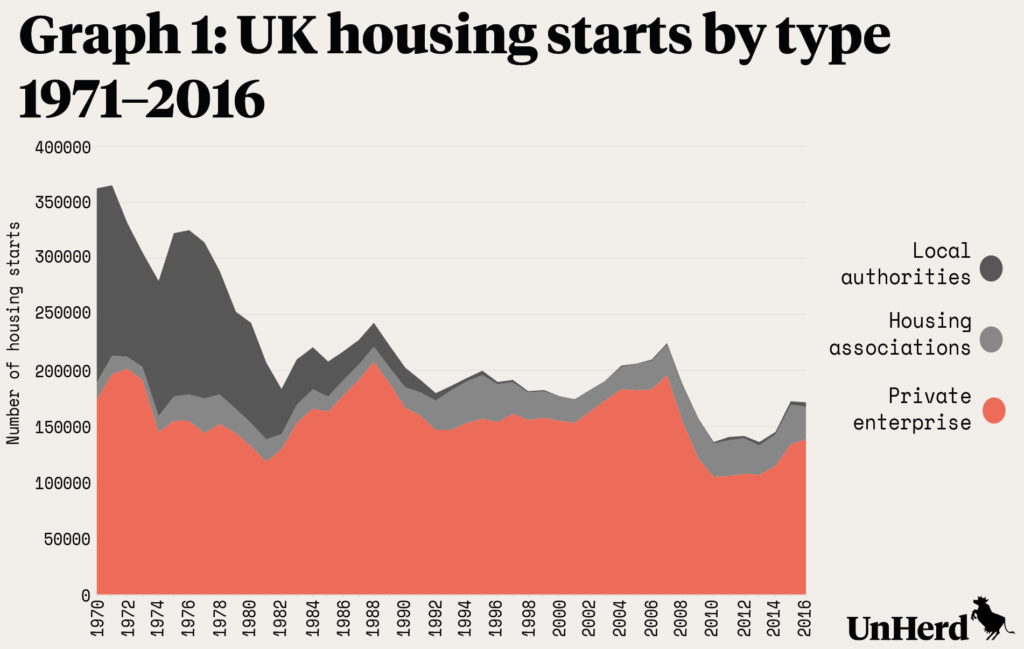
From 1979 to 1990, under Thatcher, 220,404 new homes on average were constructed each year by private builders, housing associations and local authorities.[4. Housing Associations are private, non-profit organizations that provide low-cost “social housing” for those in need. They often receive public subsidy and some borrow or issue bonds, reinvesting any surpluses.] That fell to 194,310 under Major, as fewer council houses were built, before rising gradually under Blair, then plummeting under Brown – as small and medium sized builders (SMEs) were wiped out during the credit crunch. During the Cameron years, 2010 to 2016, an average of only 141,132 homes were built annually.
New household formation is now estimated at around 270,000 per year, 25,000 higher than when the Barker report was published. Yet just 178,450 homes were completed in 2016-17 – still 50% adrift of annual demand, to say nothing of the shortfall generated over recent decades.[5. House building; new build dwellings, England: December Quarter 2017, Ministry for Housing, Communities and Local Government. For UK-wide numbers see also MCHLG live table 209]
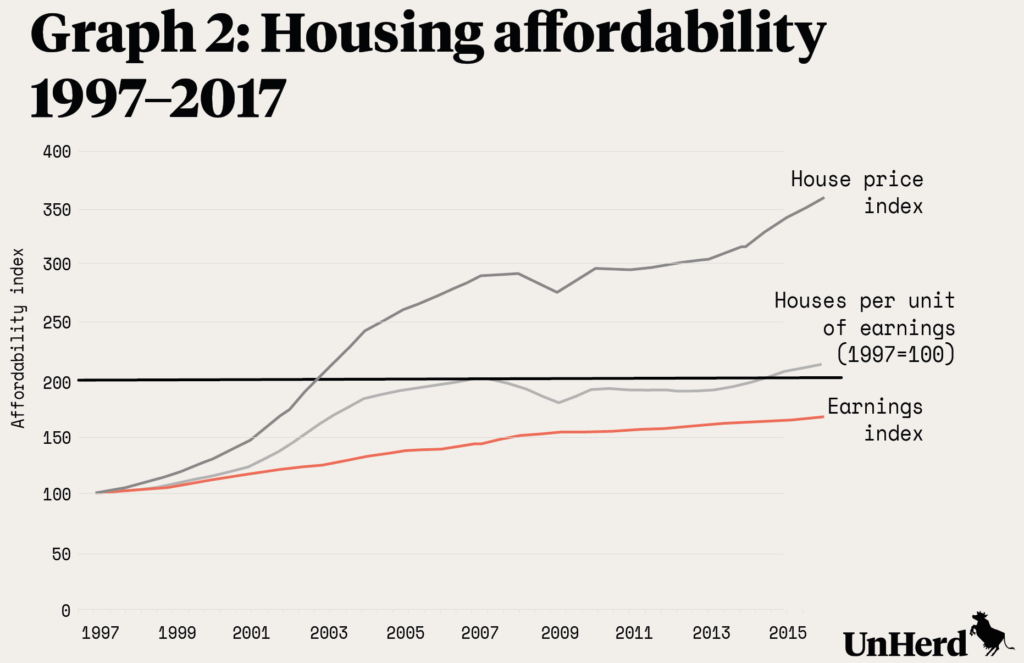
From World War Two until the mid-1990s, rapidly rising wages and steady building made house prices manageable for most aspiring homeowners. Between 1997 and 2016, though, amid slow building and much faster population growth, the average house price rose 267%, while average incomes grew just 68% – as shown in Graph 2.
Since 1997, while house prices have soared, equities have been broadly flat (volatile, but ending up roughly where they were). This has attracted speculative investment flows to housing, bidding prices up further. Similarly, since 2009, ultra-low interest rates related to quantitative easing – resulting in negative real returns on government bonds – have pushed yet more speculative money into property.
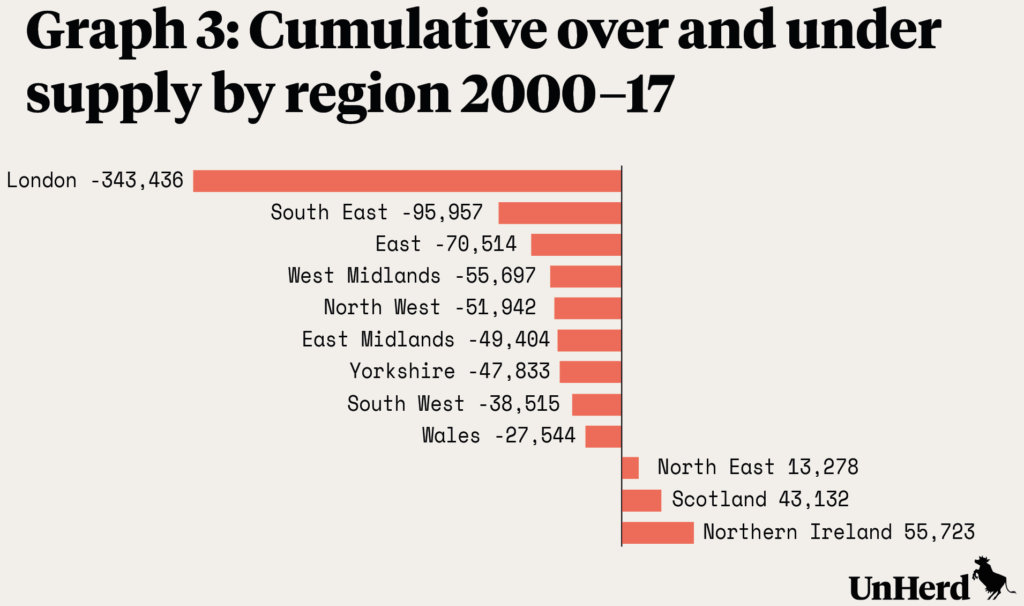
The UK-wide median house price is now 7.7 times median annual earnings – an all-time high and up from 3.5 times in 1998. But the extent of the homes shortage varies across the country. Official regional data on housing demand and supply in Graph 3 suggests a cumulative building shortfall since 2000 of 343,000 homes in London and 96,000 across the South East outside the capital.[6. Figures cited in Chris Philp, ‘Homes for everybody’, Centre for Policy Studies, December 2017.]
This “under-build” has also been significant across the Midlands, the East and the North West – other areas where prices have markedly risen. In Northern Ireland, the North East and Scotland, in contrast, a small excess of supply has been built, helping explain weaker price growth in those parts of the UK.[7. House prices in Northern Ireland are still below their 2007 peak.]
Where the demand-supply mismatch is greatest – London and the South East – house prices are 12.2 times and 9.1 times earnings respectively, as shown in Graph 4. With banks rarely lending over five times salary, a couple who both work full time will still struggle to buy, even outside the capital. And that’s before childcare costs.
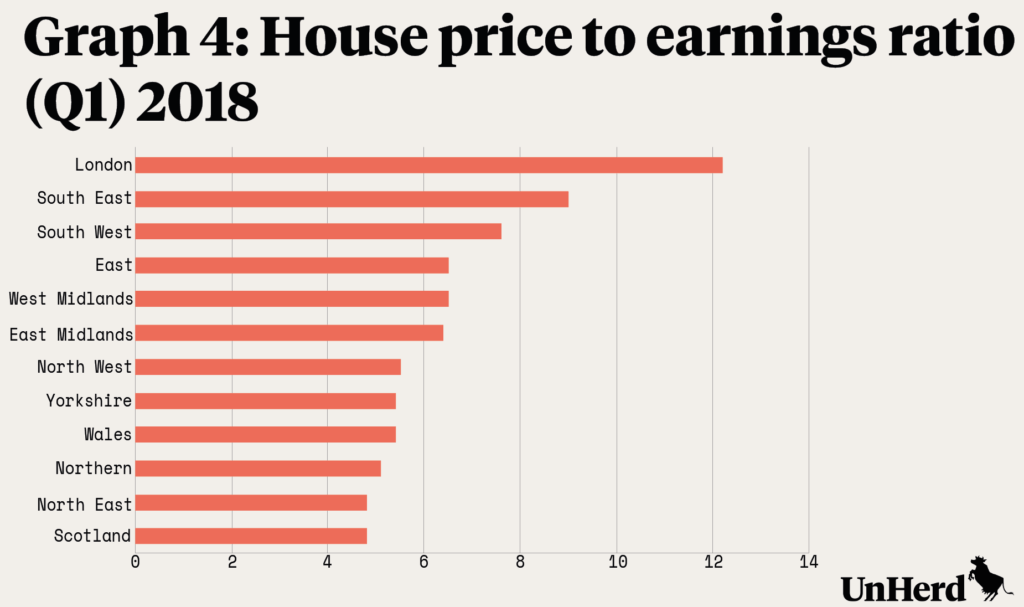
But crushing affordability multiples now extend way beyond the South East – reaching 7.6 times in the South West and 6.5 times across the Midlands. Across the entire UK, in fact, affordability multiples are well beyond the long-term UK average of 3 to 4 times.
After the 2008 collapse, lenders restricted mortgage availability. Home loans for first-time buyers (FTBs) dropped particularly sharply, from around 100,000 to 40,000 per quarter. That number has recovered to 85,000, but remains well below the 1985-2000 average of 125,000.[8. See data from UK Finance, formerly the Council of Mortgage Lenders.] In October 2017, the average income multiple granted on a FTB mortgage was 3.6-times – the highest on record. But even the UK-wide price multiple faced by FTBs was 5.2-times – a significant affordability gap.
With price growth outstripping earnings, low savings interest and limited mortgage availability, FTBs now find it far harder than previous generations to get that fabled “foot on the ladder”. Saving a tenth of their gross income, FTBs now need ten years on average to amass the necessary deposit, compared to just two years up until the mid-1990s.[9. ‘Home Affront’, Resolution Foundation, September 2017]
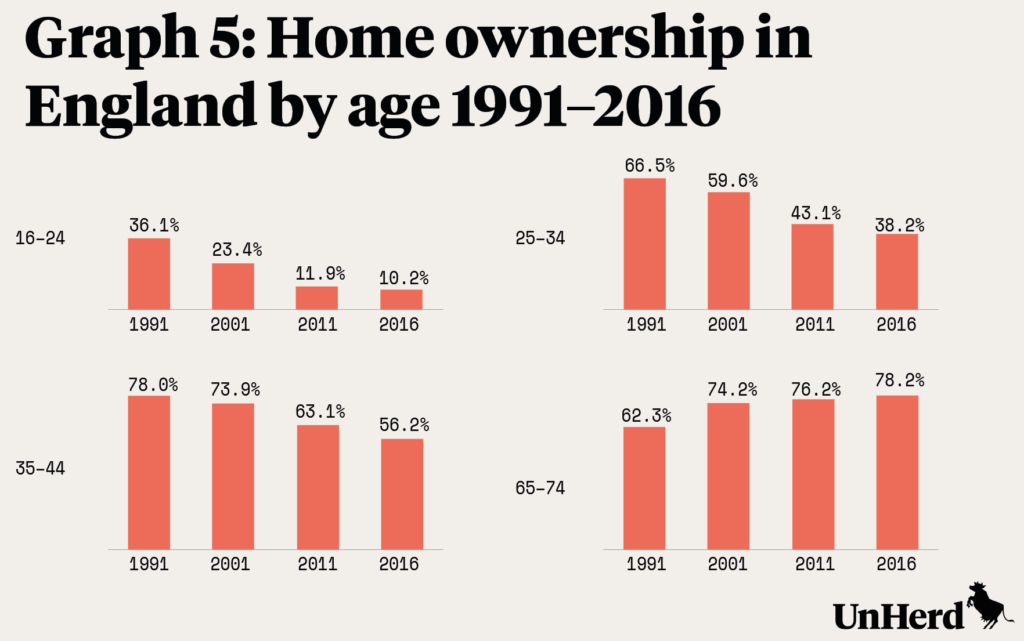
After a century of growth, UK-wide home ownership peaked at 70% in 2005 and has since declined to 63%. This is now lower than in Canada (68%), the Netherlands (67%) and the US (65%). But this steady fall in owner-occupancy, to levels still comparable with similar countries, masks a dramatic ownership decline among young adults – as shown in Graph 5.
While over a third of 16-24 year-olds owned their home in 1991, it’s now a tenth. The share of 25- to 34-year-old owner-occupiers has meanwhile collapsed from 67% to just 38% – with well over half a generation locked out of the property market at this crucial family-forming age. Moving into middle age, 78% of 35-44 year-olds were homeowners in the early-1990s, falling to 56% now. The share of pensioners owning a home, in contrast, has soared – from roughly 60% to 80%.
Only 40% of those born in the mid-1980s were owner-occupiers by the age of 30. This compares with 55% of the 1940s and 1970s cohorts and over 60% of the 1950s and 1960s cohorts.[10. ‘The Economic Circumstances of Different Generations: The Latest Picture’ Institute for Fiscal Studies, IFS Briefing Note BN187] Today’s young adults have less chance of owning than any post-War generation.
Four out of every ten 30-year olds now live in private rented accommodation, compared to one in ten during the 1960s. And overall housing costs for today’s young adults are higher than any generation for a century – with unfortunate renters driving that trend, not lucky homeowners.
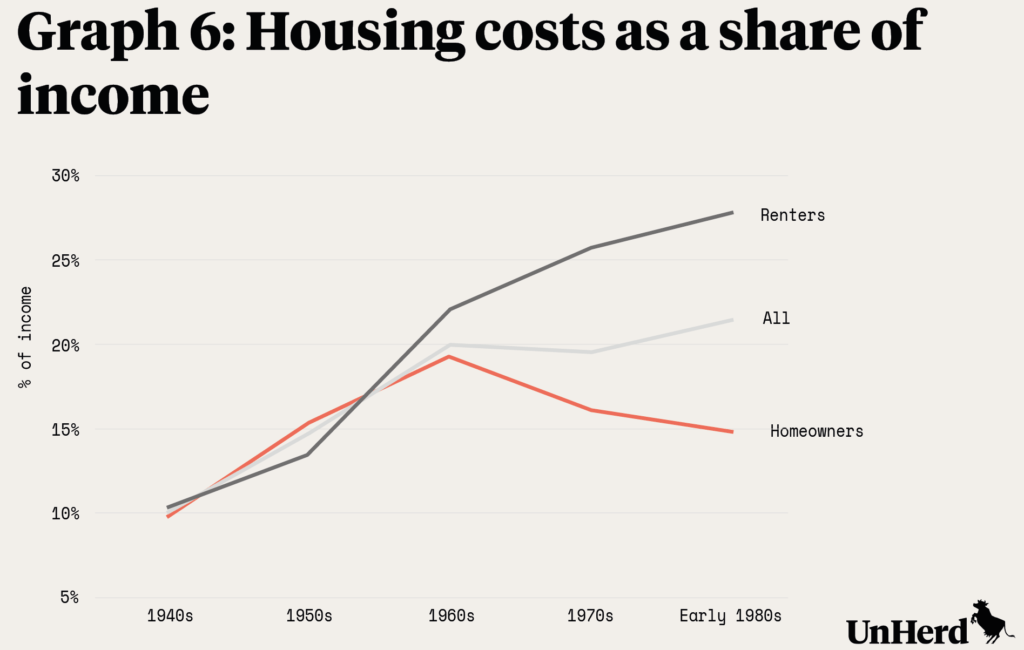
When those born in the 1940s were aged 26 to 30, they spent 10% of their income on housing costs, whether they rented or bought – as shown in Graph 6. By the time those born in the 1950s were in the same age range, their housing costs were 15% of income, with high interest rates meaning mortgage-holders paid slightly more. The cohort born in the 1960s spent 20% of their income on housing in their late-twenties, as did those born in the 1970s.
Those born in the 1980s – today’s young adults – spend 22% of their incomes on housing, not much more than their predecessors. But this average figure masks a large and growing discrepancy between renters and those who have bought. Owner-occupiers aged 26 to 30 now spend 15% of their income on housing. If you can get the large deposit needed to buy, mortgage service costs are relatively low.[11. This calculation includes only the cost of mortgage interest payments by homeowners, with capital repayment considered a form of saving. According to the property consultant Savills, renters paid private landlords £54 billion during the twelve months to the end of June 2017, more than double total mortgage interest paid by home-owners, as rising prices pushed more and more people into the rental sector. The interest paid by owner-occupier borrowers fell by £6.4 billion to £26.5 billion between 2012 and 2016, Savills calculate, while the amount paid to landlords rose £14bn over the same five-year period. ‘Renters pay £54bn to private landlords’, Financial Times, 1 October 2017]
But young renters are spending almost 30% of their income – much more in London and other hotspots. And that makes it even harder for them to save for a deposit, compounding their disadvantage.
The UK’s long-standing homes shortage, more acute in recent years, has seen house prices spiral – sparking a near-nationwide affordability crisis. Today’s generation of young adults are spending more on housing, and are less likely to be owner-occupiers, than any cohort since the 1930s. Some say home ownership no longer matters. But that isn’t the view of “generation rent” – those priced-out of the UK’s dysfunctional property market.
The next part of the Home Truths series – ‘A place of our own‘ – examines the impact of the housing crisis, while part three diagnoses the nine crony capitalist characteristics that have driven the crisis.
Part four, examining the government’s response to the crisis, will be published tomorrow and the fifth and final part will present Liam’s manifesto for radical reform.
Liam Halligan writes his multiple-award winning weekly “Economics Agenda” for The Sunday Telegraph. A panellist on CNN Talk, he has previously worked for The Economist, Financial Times and Channel 4 News.
 LiamHalligan
Join the discussion
Join like minded readers that support our journalism by becoming a paid subscriber
To join the discussion in the comments, become a paid subscriber.
Join like minded readers that support our journalism, read unlimited articles and enjoy other subscriber-only benefits.
Subscribe