


September 15 2021 - 2:00pm
According to figures released this morning, the annual rate of inflation (as measured by the Consumer Price Index) now stands at 3.2%.* Last month it was just 2.0%. The BBC is reporting this as a record-breaking increase “driven by higher food costs.”
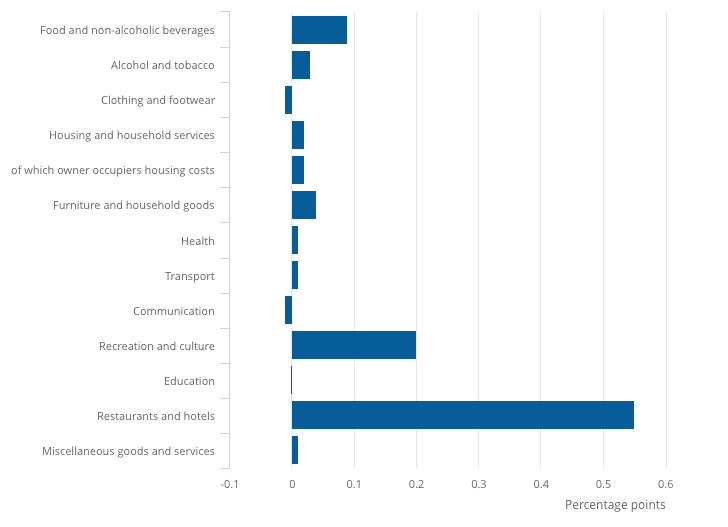
This analysis is somewhat misleading, as it might suggest that increases in grocery prices are the key driver behind the inflation. That’s not the case. If you look at the Office for National Statistics breakdown of the inflation leap, the biggest factor is the “restaurants and hotels” category, closely followed by “recreation and culture”.
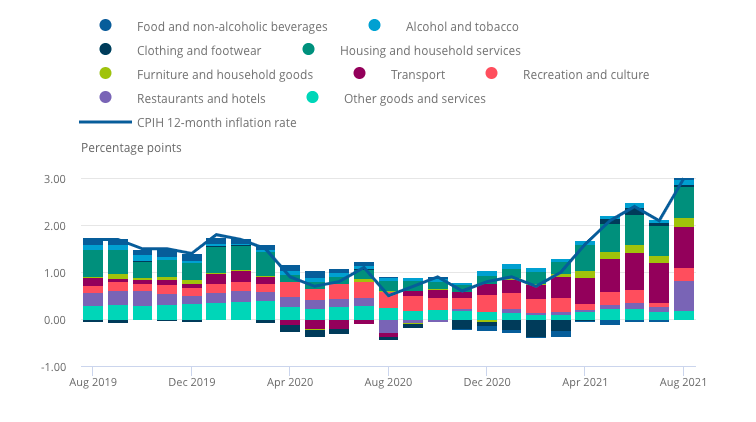
In fact, restaurants and hotels have just made their largest ever contribution to the inflation figures — as can be seen in the purple bits of the following chart:
There’s a very good reason for that. In August 2020, which is the base month for the latest set of inflation figures, prices were artificially suppressed by the Government’s Eat Out to Help Out scheme, which provided a 50% discount on qualifying meals.
This was a temporary measure, designed to revive a sector that had been stopped dead by lockdown. So comparing prices back then to prices to exactly twelve months later (which is how the year-on-year inflation figures are calculated) was bound to show a big increase in prices.
In the jargon, this is called a “base effect” and it shouldn’t necessarily be taken as evidence that runaway inflation has taken control of the economy.
So can we blame the record figures on Rishi Sunak and his now-infamous gimmick? Well according to the ONS, the CPIH inflation figures announced today would be lower — 2.7% instead of 3.0%. That’s significant, if not dramatic.
However, all the time that we’re calculating year-on-year inflation by comparing the recovery to the long months of lockdown and semi-lockdown, there’ll be all sorts of other base effects adding to the distortion of the figures. You can’t just stop an economy and start it up again without weird stuff showing up in the statistics.
Ministers and journalists alike need to interpret these indicators with care. While inflation is always a risk that must be guarded against, so too is political panic.
*Unlike the media, the ONS likes to lead with inflation figures that include owner occupiers’ housing costs (CPIH). These work out slightly lower than the CPI figures — 3.0% instead of 3.2%.
Join the discussion
Join like minded readers that support our journalism by becoming a paid subscriber
To join the discussion in the comments, become a paid subscriber.
Join like minded readers that support our journalism, read unlimited articles and enjoy other subscriber-only benefits.
Subscribe