


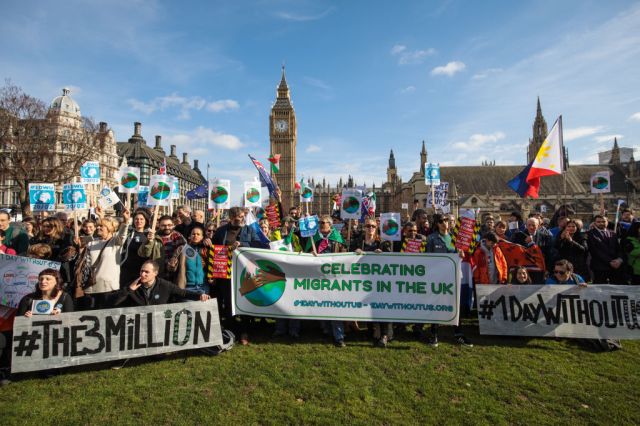
A day of action in support of migrant workers and EU citizens. Credit: Jack Taylor/Getty


The fascinating new immigration opinion data provided by UnHerd exposes the foundations of the new ethnocultural issues reshaping the British electorate. Whether we label this “open versus closed”, “globalists versus nationalists”, “anywheres versus somewheres” or “cosmopolitans versus nativists”, the new cleavage is overshadowing the old economic Left-Right divide.
Small-c conservative working-class voters have migrated to the Conservative Party because of immigration and Brexit. On the other side, successful educated cosmopolitans opt for Labour or the Lib Dems.
As a number of academics, including me, have pointed out, apart from attitudes to the EU, nothing predicts whether someone voted Leave better than their views on immigration. This shows up clearly in UnHerd’s data.
For instance, as figure 1 reveals, 55% of the variation in immigration attitudes across constituencies can be explained by Brexit vote share, a powerful association. The relationship is especially strong toward the top left, with the strongest Remain seats far more pro-immigration than elsewhere.
Figure 1
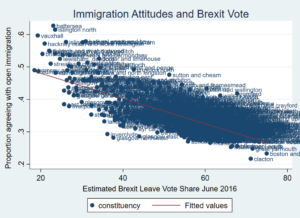
Sources: UnHerd Britain / Brexit data from: “Areal interpolation and the UK’s referendum on EU membership”, Chris Hanretty, Journal Of Elections, Public Opinion And Parties, Online Early Access, https://dx.doi.org/10.1080/17457289.2017.1287081
This rising cultural cleavage made a powerful impact in the 2017 election despite the fact Corbyn’s far-Left image gave prosperous voters a strong incentive to vote against him. But what makes Hackney different from Boston on immigration attitudes? At the constituency level, this is about demographics, of which the key ones are, in order of importance: the proportion with degrees, the level of ethnic diversity and average age. The share with a degree varies from under 5% in Clacton to over 50% in Battersea. Immigration attitudes largely track this measure, as figure 1 shows. The reason higher education is so important is not because it boosts earnings, but because it is a measure of psychological openness and a liberal worldview, both of which incline curious minds toward the pursuit of higher education.
Figure 2
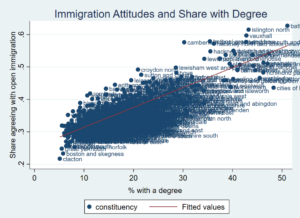
Sources: UnHerd Britain / Norris, ‘British General Election Constituency Results’
When it comes to explaining Brexit, Trump or any other western national populist vote, it’s breathtaking how resilient the narrative of the ‘left behind’ is. This suggests that those who feel they have lost out during the economic modernisation of the British economy are striking back at the elites. Yet, as I mentioned after the Brexit vote, economic factors do not tell us much about who voted Leave or Remain. As figure 3 clearly shows, unemployment level — as with other purely material factors — can’t explain immigration attitudes. The flat regression line and wide spread of constituencies around it tells us there just isn’t a story here.
Figure 3
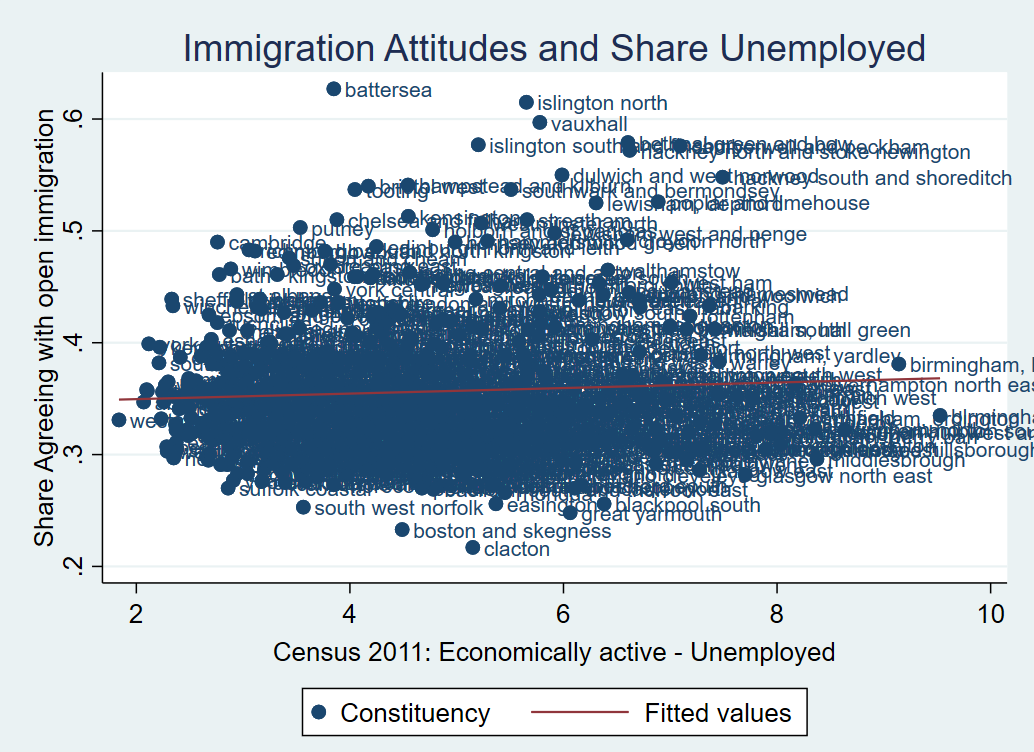
Sources: UnHerd Britain / Norris, ‘British General Election Constituency Results’
Beyond education, what social indicators underpin immigration attitudes? An important — but not dominant — factor is ethnicity. Many are fond of pointing out that places with few immigrants seem to be the ones most concerned about immigration. Yet this statement completely sidesteps the fact that a high-immigrant area will have lots of immigrants in it! Since immigrants and those who are from minority communities tend, all else being equal, to be more pro-immigration than White Britons, highly diverse constituencies are also more open to immigration, something evident in figure 4.
Even so, there is considerable variation around the trend line. Constituencies with a more educated population tend to lie above the line, and those with fewer degrees below it. In addition, there is an important current of immigration restrictionism among ethnic minorities, especially those who are UK-born. This is more pronounced in constituencies with a higher Sikh and Hindu component to their minority population since these groups are more restrictionist than other minorities, and less so in places with a higher Afro-Caribbean share, as they are relatively liberal on immigration compared to other non-White British groups.
Figure 4
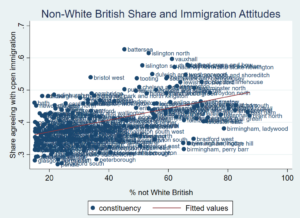
Sources: UnHerd Britain / Norris, ‘British General Election Constituency Results’. NB: excludes constituencies with less than 20% non-White British share (a majority of seats)
The share of the population aged 20-24 is also an important correlate of immigration attitudes, with younger constituencies more ‘open’ and older ones more ‘closed’ in immigration outlook. Yet this matters considerably less than education or ethnicity. The share of passport holders, however, is an indicator, even when we account for its relationship with education, age and ethnicity. Figure 5 shows the importance of this association.
Figure 5

Sources: UnHerd Britain / Norris, ‘British General Election Constituency Results’
Education, ethnicity, share without a passport and age account for nearly 80% of the variation in immigration opinion across constituencies. This means almost all of the differences in immigration attitudes over place have to do with these demographics. But is there any role here for the properties of place — whether local tradition, regional economy or cultural atmosphere?
The answer is a qualified yes. Even with controls for education, ethnicity, age and share without a passport, London emerges as somewhat more open, and the East of England and South East somewhat less so. We should bear in mind, however, that regional differences are small. Apart from London (at 46% agreement), the share agreeing with open immigration fluctuates in a tight band from 32% in Wales to 36% in Scotland. When you account for education, ethnicity and age composition, London remains only 3 points more pro-immigration than the supposedly restrictionist East of England. Moreover, some of this may be due to social indicators we haven’t included in the model, so the geographic effect may be weaker still.
Geography is important, but it’s also vital to appreciate its limits, which too many pundits fail to do after perusing an election map. A map of SNP vote by British region would suggest that living in Scotland explains 100% of the variation in SNP voting among people. It doesn’t. Mapping state income and the Democratic vote in America would show that richer states back the Democrats. Yet richer individuals aren’t more likely to vote Democratic than poorer people. In other words, you can’t simply read individual-level relationships off aggregate correlations. More than that, most of the variation (90% or more) in attitudes lies within constituencies, not between them.
Consider university education, the most important cross-constituency predictor of immigration attitudes in Britain. When we drill into the survey data on individuals (as distinct from constituencies) — using the British Election Study — we find that education is much less important. That is, once we take psychological factors such as the death penalty into account, having a degree makes only a modest difference to immigration attitudes.
Figure 6, based on a sample of around 20,000 individuals, shows that a person’s views on the death penalty matters vastly more than whether they have a degree in predicting whether they want less immigration. Almost 9 in 10 strong death penalty supporters back restriction against barely 3 in 10 strong opponents of capital punishment.
Next to this 60-point chasm, the roughly 5-point gap between those with and without degrees pales into insignificance. While graduates are less likely (41%) than non-grads (62%) to back the death penalty, this is beside the point. The massive difference between pro- and anti-death penalty supporters holds as strongly within the population of university graduates as it does among non-graduates.
Figure 6
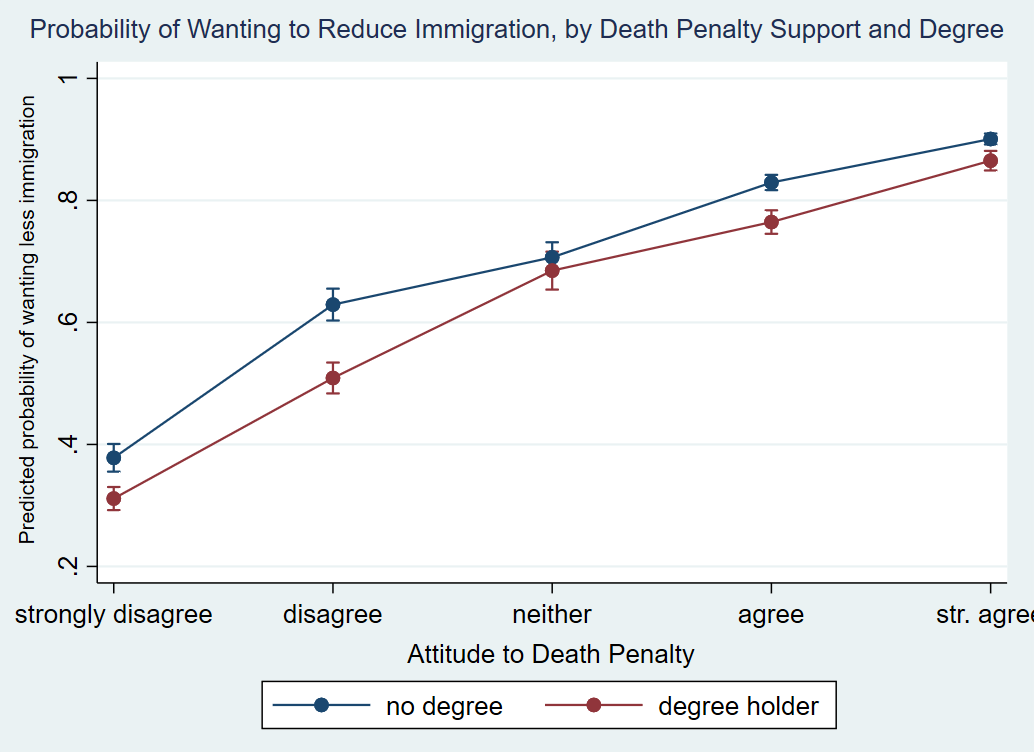
Source: British Election Study Internet Panel Study wave 9, 2016
As I argue in my book Whiteshift, immigration attitudes are the fulcrum around which the politics of western societies are realigning. This is because those whose psychological make-up inclines them to see difference as disorder and change as loss are voting for parties that promise to slow immigration. This isn’t generally about competition for jobs or services, which is a safer narrative to voice, but instead mainly about majority-ethnic and what I term ‘ethno-traditional’ national identities. Conservative voters feel that these are being unsettled by the rapid ethnic shifts sweeping across western countries.
The Brexit vote was primarily driven by the immigration question, though the focus on the economic risks of Brexit is presently overshadowing the subterranean force of this issue. Should Johnson ink a deal while failing to reduce migration levels, we should expect this debate to return — intruding as sharply into British politics as it did in the runup to 23 June, 2016.
Eric Kaufmann is Professor of Politics at the University of Buckingham and author of Taboo: How Making Race Sacred Led to a Cultural Revolution (Forum Press, 4 July).
 epkaufm
Join the discussion
Join like minded readers that support our journalism by becoming a paid subscriber
To join the discussion in the comments, become a paid subscriber.
Join like minded readers that support our journalism, read unlimited articles and enjoy other subscriber-only benefits.
Subscribe