


Blurred light trails along the M4 motorway – past Swindon, North Wiltshire (Getty)


This is part of the “How flyover country was misruled” series that Henry Olsen introduced last week with his “Blindsided” piece. Other instalments will be published in coming days.
I once had a well-rehearsed line when asked where outside London I lived. “The Oxfordshire border” or “the edge of the Cotswolds” was usually enough to establish social commonality, acceptance into home counties ‘commuter life’. Now I delight in the looks of bewilderment when I admit my secret. I live in Swindon.
I understand the scepticism. Based on official statistics, Swindon is completely and perfectly average. It is a microcosm of the UK. Someone should tell Dylan Jones, editor of GQ magazine, who once said of Swindon that “in all its pebbledash and Anaglypta glory, it has to be the ugliest town in England”[1. Dylan Jones, Dylan Jones visits the ugliest town in England, Daily Mail, 1 February 2008].
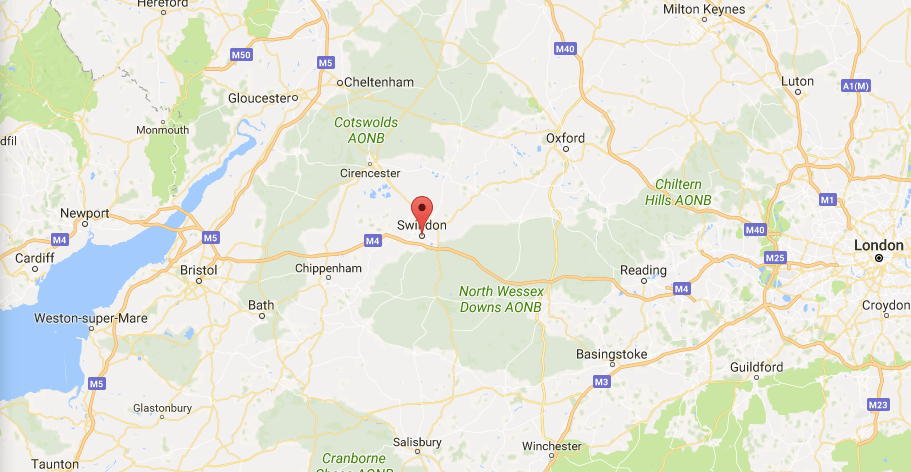
We are used to the sneering. After all, Swindon is the UK equivalent of a ‘flyover state’, a drive-past place on the M4 corridor between London and Bath. Swindon is an odd paradox of being forgotten and yet known. Our infamy stems from our Magic Roundabout and our cult-like cultural status as Britain’s quintessential “s**t town”.
Yet turn off the M4 or catch the train from Paddington, and you will see that Swindon is anything but average. At one end of the town centre is the area that has earned us the title ‘pop-up brothel capital of the UK’. At the other is the old railway ‘village’ from which came the blueprint for the NHS. This average town is nothing but unexpected. We are the home of the UK Space Agency and the final resting place of James Bond creator Ian Fleming. In this, Swindon is perhaps the best illustration of the problem of averages.
The attraction of average
There is a certain attraction in average. Averages are simple and easy to understand. They help us give context to information that may otherwise seem random. If you get 73% on a test, it is hard to tell whether it is good or bad without the class average. The ability to compare proves important for things like well-being. Studies show that income relative to peers has more of an effect on well-being than how much you actually earn[2. The Easterlin Paradox, see more recent discussion in: Z Yu and L Chen (2016). Income and well-being: relative income and absolute income weaken negative emotion, but only relative income improves positive emotion. Frontiers in Psychology, Vol 7].
Averages also solve the problem of limitations on data collection. Pollsters can’t poll everyone, so they poll 1,000 people who collectively are a good ‘average’ of the wider population. Averages also help solve temporal restrictions on data. We can’t, by definition, measure how many Swindon residents are going to need hospital care next year, but we still need to make a decision about health services. However, we can measure on average how many people were admitted in the past and adjust that average to predict and plan for the future.
Average also fits well with the general operation of post-war social democracy, particularly in heavily centralised states like the UK. The idea of a single approach to a problem reflects the notion of an ‘average’ person or outcome that can be targeted. How else do you measure the impact of a policy to reduce the prevalence of diabetes, or lift educational attainment, other than through average rates of diabetes and educational attainment?
The limitations of average
There is a certain attraction in averages, but they are fraught with problems. Firstly, they are highly influenced by extreme values. Take 99 nurses and the average salary in the room is unlikely to be much above £20,000. In walks Lionel Messi, earning £500,000 a week, and suddenly the mean average income has risen to more like £270,000.
The distortion caused by this ‘power law’ reflects one of the biggest problems of averages. Once Messi walks in and the average income jumps, that average bears no relation to the actual income of anyone in the room. Nor does this problem improve when you increase the number of people involved. In the 1950s, the US Air Force designed cockpits to fit the ‘average’ pilot, one whose key body measurements were all within the middle 30% of the range of measurements recorded. But when these averages were compared to the measurements of 4,063 pilots, not a single pilot was within the range for all attributes[3. Todd Rose. When US Air Force discovered the flaw of averages. Toronto Star, January 16th 2016]. Average does not exist.
Worse than that, average hides what actually exists: inequality. Some of these inequalities are irrelevant. Some people are significantly taller than others, so what? However, some of the inequalities are anything but trivial. Swindon may be the average town, but outcomes here are anything but average.
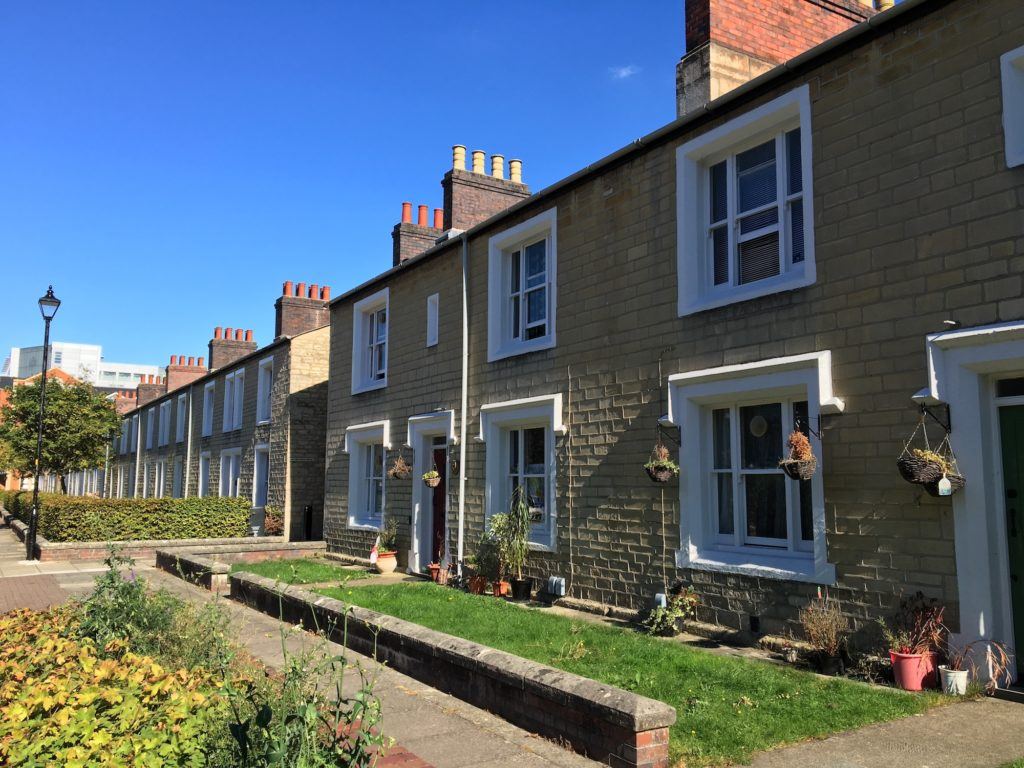
Swindon is actually a town of halves. The original settlement, the ‘Old Town’, sits on top of the hill overlooking the ‘new town’ that grew around the railway when the Great Western Mainline opened in the 1840s. Old Town is home to thriving cocktail bars and organic flat whites. In the bottom of town, vacant buildings host the homeless in their doorways, and migrant communities live in dilapidated terraced streets. There is little in between.
The lack of average is not just physical. I am not sure what the average job in Swindon would be, but it would have to be some combination of car manufacturing, financial services, distribution, and socioeconomic research. Differences in attitudes and opportunities match, further complicating what ‘average’ means for policy:
Simon worked in IT all over the world before settling in Swindon. “People constantly talk down the town, they are so negative. But it is a great place to live. Jobs are good and everything you need is here.”[4. Interview with the author, Swindon, 25 September 2017]
Cameron is an apprentice at Honda and while he sees opportunities at work, he is less convinced by Swindon. “If anyone asked me what the best part about Swindon is, I’d be hard pressed to think of one. Most of the place looks like a run down junk yard.”[5. Interview with the author, Swindon, 28th September 2017. Name changed to protect the anonymity of the individual.]
The average between Simon and Cameron’s views bears no relevance to either’s life.

The consequences of average
The problems of average have consequences. First, if average doesn’t exist, plans based on averages are likely to fail. If hospitals don’t have enough beds, operations have to be cancelled. If they have too many beds, then resources are not being used properly. There is a cost associated with mismatched supply and demand. Rather than planning hospital beds based on past averages, studies suggest that you may need 30% more beds than average to be able to absorb fluctuations in demand.[7. De Bruin et al. (2007) Modeling the emergency cardiac in-patient flow: an application of queuing theory. Healthcare Management Science Volume 10 (2), pp 125-137.]
Second, averages are ambiguous, which means at best they are easy to misinterpret and at worst easy to game. Rising averages can hide bad news. Let us assume that average hours of physical activity in Swindon have risen. Good news for health outcomes, right? Well not necessarily. It could be that everyone in Swindon has become more active, or that new services aimed at getting the least active to do more exercise have been successful. Both would be good. However, it could also be that a new gym has opened for fitness fanatics. Those doing a lot of physical exercise already are now doing even more but with marginal additional health benefits. At the same time, those who are doing barely any physical activity have decided to do none at all. Average hours of physical activity have gone up, but they have actually fallen in the group where health gains are made. Averages make us worry about the average, when actually we should be worried about the tail.
Averages also make measuring the impact of government intervention quite challenging due to issues like the Simpson Paradox. This is where the average trend within a population can be the opposite of the trend when that population is broken down into groups. For example, one intervention A may prove more successful than B overall, but only because it was applied to less challenging cases. When the challenging and the less challenging cases are separated, intervention A may have been less successful than B in both groups. Government may press ahead and roll out intervention A thinking it is the best option, when actually it is less effective all round.
These ambiguities make averages easy to game. Let’s assume there is a target to lift average income in Penhill. If you were to move the ten poorest families from Haydon Wick (who are still richer than the Penhill average) into Penhill, then average income would rise. But here is the perverse thing, so too would average income rise in Haydon Wick. A double success story, but no family has actually seen their income change.
Swindon’s communities are strong, but distinct, the result of the progressive development of the town, new ‘village’ by new ‘village’. Retired industrial workers who used to press panels for Britain’s most iconic cars still live near the plant (now part of BMW’s mini production) in Stratton. Affluent, aspirational young families live in Priory Vale, one of the newer parts of Swindon. If you are looking for average, you won’t find it.
The evolution of Swindon as a series of communities perhaps makes geographical inequalities more extreme. In an affluent corner of Haydon Wick is a community who are the 1%. That is, they live in the 306th most affluent part of England, out of 32,844[6. Lower Layer Super Output Area, including approximately 1500 people. There are now 34,753 LOSAs in England.]. Walk past these large detached homes into the scrubland that divides Swindon’s developments and you cross a brook into Penhill. This is the bottom 4%.
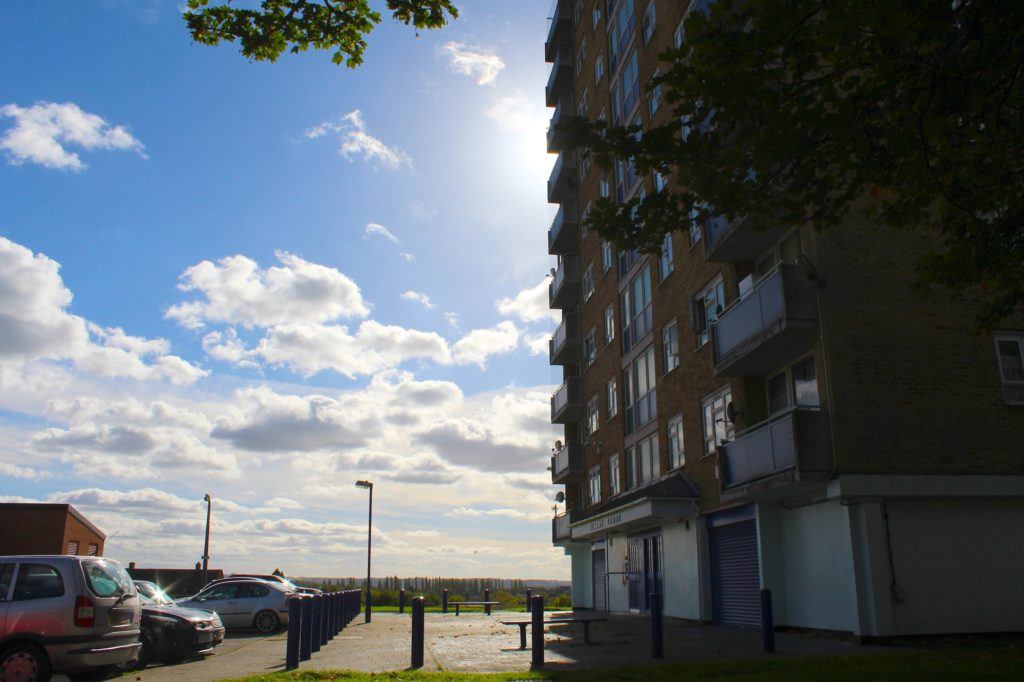
Penhill is one of Swindon’s estates, a close and friendly community to the north of the town. Wide streets of post-war council houses and fenced gardens lead to greens dotted with tower blocks. Here, 53% of children grow up in income deprived households and a staggering 98% of under 21s do not progress to higher education, the 20th highest rate in England. The education deficit here is clear. Penhill Central has the 33rd highest level of education and skills deprivation in England, putting it in the bottom 0.1%.
The brook is small but it may as well be an ocean. The distance is less than 100m, yet the act of crossing that bridge sees life expectancy for men fall by nearly 10 years. These inequalities matter, and they are totally hidden by broad averages. Even within these small clusters, the average hides the different experiences and attitudes of families. David has three children and is currently working and studying. “I went back to college, to get better skills so I can get a better job. It is important for my family to have a good life.”[6. Interview with the author, Swindon, 28 September 2017.] But other children in the same street are sent to school with no jumper. Some haven’t eaten since the previous day. This is the average’s worst crime. From social challenges and the decisions taken to address them, it removes the human face.
Thirdly, averages can lead to perverse incentives. For example, education policy has more recently focused on punishing schools that get ‘below average’ results. On the surface this seems sensible, however, the reality is that schools then face a disincentive to teach harder subjects in which students are less likely to get a good mark. It also incentivises the chasing of a goal that can never be realised, for the very act of trying changes the target. As results improve, so too does the average. Not everyone can be ‘above average’.
But perhaps the biggest problem is the way averages make us view individual progress. We define an individual’s achievements relative to those of a mythical ‘average’ person. In Penhill, some children start school with no language skills at all. One boy is often late to school because he must first dress his mum. Sometimes she is in such a catatonic state of depression he rings the school office to say “I can’t get mum dressed, help”. The boy is eleven. David is seven and he sleeps at school some afternoons. At home he has no bedroom, nowhere safe to bed down. At night he sits upstairs listening to man after man come through the house for sex. When life is like this, how is average even remotely relevant?
It is a testament to the efforts of Penhill’s primary schools and other services that a lot of these children do achieve the ‘average’ as they transition to secondary school. However, the average hides the struggle. In the words of one local headteacher, “average is hard won for these kids”. Being labelled as ‘average’ does not do them justice. Progress is by definition relative, but it is relative only to the individual.
AUDIO FROM PENHILL
https://soundcloud.com/user-970100804/harriet-maltby-audio-essay-on-swindon
An alternative to average?
At the heart of the problem of average then, is a problem of relativity. Progress, policy, and their measurement need to be more personal.
There is no reason why they can’t be. Averages certainly solve the limitations on the collection and use of data, but so too do digital tools. Historically, the idea of individual level data was fantasy. Not now. Some governments are already embracing technology in a bid to gather more individual data to inform policy making. The New Zealand Treasury developed an online platform through which communities and individuals can report their progress and needs direct to the government. The days of statistics being modelled by statisticians in national agencies aren’t quite over, but they are definitely numbered.
The consequences of this is that it will be perfectly possible for progress to be measured relative to potential and ambition, not the ‘norm’. There is some value in averages like GSCE results, but there is even more value in being able to see the extent to which students are achieving their potential and ambition, rather than the threshold pass marks. The same headteacher in Penhill remarked that “data for a child is unique, like a fingerprint. We need to look at how education is working for that child’s unique situation.”[8. Interview with the author, Swindon, 4 October 2017] In such data a real insight into education outcomes can be attained.
As data localises and individualises our understanding of progress and problems, policy must adapt to reflect this. The devolution agenda is beginning this process. In Swindon, the Council has gone further, negotiating the devolution of services with existing and new Parish Councils. Talking to the Leader of Swindon Borough Council, David Renard, it is clear that policymakers saw an opportunity to better reflect the needs of Swindon’s distinct communities:
“Working more closely with parishes means that decisions about the local services people see and enjoy everyday are made by communities and tailored and delivered to meet local needs. It also means that taxes raised in each community are ring fenced specifically for those services and are not in competition with town-wide budget pressures such as social care.”[9. Interview with the author, Swindon, 7 October 2017]
Local need is better reflected in local decisions. Haydon Wick has a relatively elderly population. To combat physical and social isolation, the parish runs a community bus for shopping and lunch trips.
In giving more ‘state’ power to local areas, there is an increasing acknowledgement that government is not necessarily the go-to instrument for change. The omniscient state is as mythical a concept as the average. If policy is to be truly personal, then civil society is best placed to make a difference. Some of the most successful local projects in Swindon are a marriage of community and state. In Penhill, local green thumb and community leader Glynis started a community garden. Penhill Haven grows vegetables for the local food bank and has worked not only with young offenders and community payback, but also with the Council’s young wardens scheme to involve the estate’s kids. In average Swindon there are extraordinary people.
The problem of average perhaps has one final relevance for Swindon, one that is at the heart of the town’s existential crisis. Just as the average is meaningless to the individual, so too is it irrelevant to the ‘average’ town. In being labelled ‘average’, this town of exception struggles to shake the stain of post-industrial decline. In that way it shares many similarities with the old mining towns of the North East. It is not just its long terraced streets and retired labourers, but its wistful obsession with past glory. When the pride and focus of the town is gone, what is left but nostalgia for the pits? Everything that Swindon is and was, came from the railway. The steam has gone and Brunel’s great engine sheds are a shopping centre, but Swindon’s search for its identity goes on. In the minds of Swindonians, Swindon is not average. The challenge is educating the world.
Swindon is perhaps ironically ‘average’ in just one way. Its social challenges and inequalities are not exceptional, but replicated in many towns, cities, and rural communities across the UK. But we shouldn’t worry about how we compare to other towns. If we forget about the average, and instead try to lift the tail and support the individual, then the average will rise anyway. The best we can hope for is that no-one notices.
Harriet is a freelance writer and self-confessed data addict. She was formerly Head of Policy for the Legatum Institute’s global Prosperity Index. Prior to that, she was Senior Parliamentary Assistant to a Conservative Member of Parliament.
 HarrietMaltby
Join the discussion
Join like minded readers that support our journalism by becoming a paid subscriber
To join the discussion in the comments, become a paid subscriber.
Join like minded readers that support our journalism, read unlimited articles and enjoy other subscriber-only benefits.
Subscribe