


September 15, 2021 - 2:00pm
According to figures released this morning, the annual rate of inflation (as measured by the Consumer Price Index) now stands at 3.2%.* Last month it was just 2.0%. The BBC is reporting this as a record-breaking increase “driven by higher food costs.”
This analysis is somewhat misleading, as it might suggest that increases in grocery prices are the key driver behind the inflation. That’s not the case. If you look at the Office for National Statistics breakdown of the inflation leap, the biggest factor is the “restaurants and hotels” category, closely followed by “recreation and culture”.
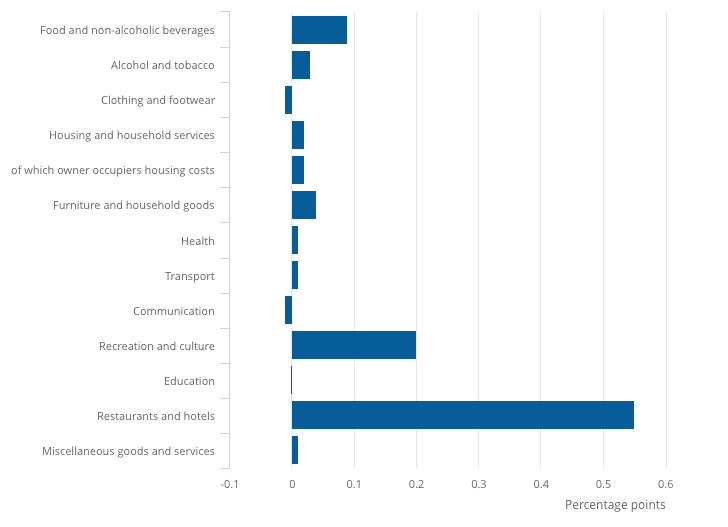
In fact, restaurants and hotels have just made their largest ever contribution to the inflation figures — as can be seen in the purple bits of the following chart:
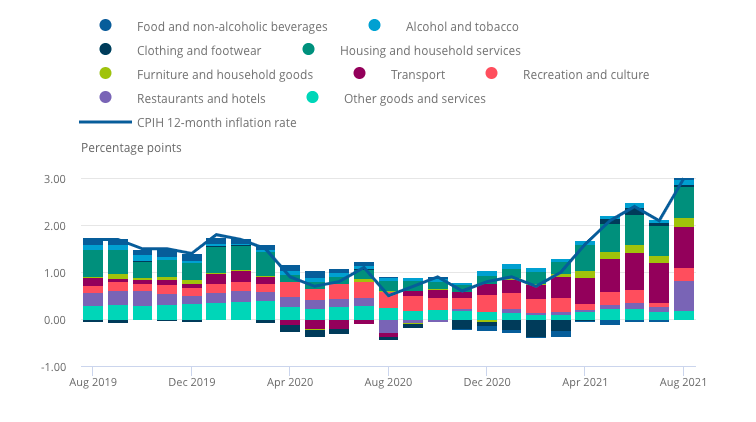
There’s a very good reason for that. In August 2020, which is the base month for the latest set of inflation figures, prices were artificially suppressed by the Government’s Eat Out to Help Out scheme, which provided a 50% discount on qualifying meals.
This was a temporary measure, designed to revive a sector that had been stopped dead by lockdown. So comparing prices back then to prices to exactly twelve months later (which is how the year-on-year inflation figures are calculated) was bound to show a big increase in prices.
In the jargon, this is called a “base effect” and it shouldn’t necessarily be taken as evidence that runaway inflation has taken control of the economy.
So can we blame the record figures on Rishi Sunak and his now-infamous gimmick? Well according to the ONS, the CPIH inflation figures announced today would be lower — 2.7% instead of 3.0%. That’s significant, if not dramatic.
However, all the time that we’re calculating year-on-year inflation by comparing the recovery to the long months of lockdown and semi-lockdown, there’ll be all sorts of other base effects adding to the distortion of the figures. You can’t just stop an economy and start it up again without weird stuff showing up in the statistics.
Ministers and journalists alike need to interpret these indicators with care. While inflation is always a risk that must be guarded against, so too is political panic.
*Unlike the media, the ONS likes to lead with inflation figures that include owner occupiers’ housing costs (CPIH). These work out slightly lower than the CPI figures — 3.0% instead of 3.2%.
Join the discussion
Join like minded readers that support our journalism by becoming a paid subscriber
To join the discussion in the comments, become a paid subscriber.
Join like minded readers that support our journalism, read unlimited articles and enjoy other subscriber-only benefits.
SubscribeInflation in USA is 5.4%, and many say it is at least 9%. My guess is in UK it also is.
The Government debts run up in almost all the world are not possible to pay, and so are to be inflated away.
This is exactly how WWII was paid for with a real inflation of 14% just taking a couple years to cut it in half.
Inflation is a TAX.
The government uses it to pay down their debt. They take spending power from $, to take value from the debt – making it easy to pay off.
At the same time Interest is kept ZERO (below zero in Europe and Japan) so the debt can be serviced. In USA the debt is so great it takes 1.5$ Trillion to service at 10 year Treasuries being at 1.4% In USA the ‘Fixed Mandates’ (Medicare, Social Security pensions, pensions) and Federal Debt service take 100% of all Tax revenue, 3.5$ Trillion. All other costs are met by borrowing! Military, millions of employees, and all Federal expenses! USA is 138% of GDP in debt, and growing Very fast indeed.
In Fact the USA government is not only in deficit spending to meet the budget – BUT all the interest to service the debt is Borrowed! The country borrows to pay the interest on the debt, thus growing the debt! No country in history has not had its Fiat money destroyed by hyperinflation once they get to this point. (actually Japan managed it – but was very heavy in foreign cash reserves, which no one but Germany is now)
But the bigge for us, Inflation eats savings! The middle class, and any savings, are eaten along with pensions. 5.4% inflation Minus the 1.4$ interest of a 10 year treasury bond (and to get that means 10 years locked in – other interest like bank savings accounts are under 0.25%) is Negative 4%, -4% on your pension and savings. If the Inflation is 9% as many say it is a -8.75% if you have it in a savings account!
See how inflation is a TAX? The government takes your spending power to reduce their debt by devaluing the currency. And it is a totally regressive tax as well. The wealthy have appreciating assets, so they do not pay the inflation tax!
The last part is this inflation and zero interest means savers are forced to the equities market – (the stock market) to keep up with inflation. That means they are forced to Risky investments. That means when the stock market ‘Corrects’ they will take huge losses……
Your government hates you if you work hard and have savings. It only likes the poor (their clients) and the wealthy (their owners).
As anybody with any exposure to the construction industry, manufacturing, or any commodity trading, can tell you, inflation is rapidly getting out of control.
Nonsense like this just reinforces the belief that those in charge have absolutely no clue what’s going on.
Have you seen gas and coal (and hence power) prices today!?!?
Through the roof.
The inflation is 100% engineered. The stimulus checks, helecopter money, Fiscal Stimulus, is done to cause inflation. Monitary stimulus does not cause inflation (QE – that is done to keep interest zero and prop up asset prices), only Fiscal stimulus really causes inflation, and thus what is essentially UBI (Biden’s 4.5$ Trillion ‘Human Infrastructure) is pumped out to cause inflation.
Money is borrowed into existence by the Fed/Treasury, and handed out to low income, and this inflates the Currency, creating Inflation,, harvesting the middle class savings to pay for it. All that waste, all the insane lockdown corruption and waste – the Middle class pay it back. But the thing is – it is going to destroy the economy, and that is also the plan. (CBDC is what is going on – it will have all kinds of unpleasant effects on us…)
Yes…… I have no idea whatsoever why a Conservative government with support largely from the middle classes would be trying to at the same time to shaft them.
‘The PLAN is to destroy the economy’ – among many loony things you have posted on here, that must take the biscuit, or cookie as you’d no doubt prefer.
Yes, we see a lot of increases this year in raw materials or manufactured products or services that we use in our business.
They are not trivial increases , but in the range 5-20%.
Lead times have gone up enormously too, and that , in effect, is a cost increase in time-critical operations, since you have to hold more inventory . And all operations are time-critical to some degree.
All these rises are in the pipeline and yet to hit consumers but the media is obsessed with consumer retail and the entertainment industry as if that is the whole economy.
I have to conclude that the main reason they don’t see all the things I have mentioned is that they are clueless,technically ignorant and incurious about the invisible stuff that holds their world together.
Eat Out to Help Out is only infamous with hysterical types that blame it for a rise in infections later in the year. As always with Covid the evidence for the claim is non existent and is driven more by commentators political prejudices.