


June 9, 2020 - 7:00am
Last week, there was one piece of good news: an unexpected drop in America’s unemployment rate. Economists expected the figure for May to be even higher than the one for April (14.7%) but instead it fell to 13.3%. The economy gained 2.5 million jobs — a monthly record.
This revived hopes of a V-shaped recovery — i.e. one where the upswing is as rapid as the downswing. A delighted Donald Trump claimed that “This is better than a V. This is a rocket ship!”
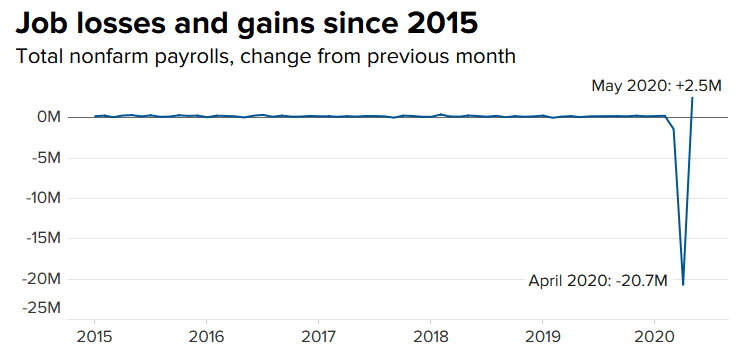
A graph published by the business channel CNBC added to that impression. It shows month-on-month job losses and gains since 2015. In April, 20.7 million jobs were lost. That’s an unprecedented number — one that, by comparison, reduces the up-and-downs of the previous five years to a flat line (until, that is, it plunges downwards between March and April). Now, with the May figures, the precipitous drop has soared back up again — giving an extreme V-shaped impression.
The eagle-eyed among you will have spotted that 2.5 million jobs gained in May is a very partial compensation for the 20.7 million lost in April. A graph of the employment level itself (rather than monthly change in the employment level) would not be V-shaped at all — it would show employment falling off a cliff, and then rebounding slightly.
We don’t know for sure that unemployment has bottomed-out. But even if it has, the improvements we’ll see in the months ahead may be hiding more bad news. The easing of lockdown will allow some businesses to come back fast (hairdressers, for example). But for others, like airlines, it won’t be so easy. Therefore, the recovery of overall employment could conceal rises in long-term unemployment in the worst affected parts of the economy.
This same effect can be seen elsewhere. For instance, the CNBC article has a graph based on data from Apple Maps. Between March and April requests for travel directions plunged by more than 50% on pre-pandemic levels — testament to the impact of lockdown on mobility. But since then, there’s been a recovery. Among car-users, the level is almost back to normal. However, among transit users it’s still way down. Public transport is fragile to Covid in a way that the private car isn’t.

Join the discussion
Join like minded readers that support our journalism by becoming a paid subscriber
To join the discussion in the comments, become a paid subscriber.
Join like minded readers that support our journalism, read unlimited articles and enjoy other subscriber-only benefits.
SubscribeSo Mr Economist rather than stating the obvious what would you do to make sure that the impacts of Covid-19 are mitigated given what you know at the moment? Most economists are v good at analysing what’s happened…not so good on proposing practical solutions to mitigate potentially and in this case wholly predictable events… and v good at articles like this that say we’re all doomed. 10 a penny
I would love to believe the 13.3% figure for May, but hardly had it been issued than the Bureau of Labo(u)r Statistics (BLS) said there had been a “mistake”.
I haven’t heard what the correct figure should be but, the inference from the BLS is that it will be higher.
Mark, I believe the corrected figure would be 16.2%. According to Annalyn Kurtz of CNN Business: “the BLS noted that for the third month in a row, its data collectors misclassified some workers as ’employed not at work,’ when they should have been classified as ‘unemployed on temporary layoff.’ If it weren’t for that issue, the unemployment rate could have been as high as 19.2% in April and 16.1% in May, not including seasonal adjustments”. So this compares to the 14.4% April rate and 13.0% 13.0% May rate that were published before seasonal adjustment, not the 13.3% seasonally adjusted May rate you note, or the 14.7% April rate. I don’t think BLS has released the correction based on seasonally adjusted estimates. If you simply use the same implicit seasonal factors as those used for the published estimates, the correct seasonally adjusted estimates would show a 19.6% rate for April, declining to 16.5% for May. If one looks at the movement, not the level, it is still really good news for the American economy.
Many thanks Andrew, mystery solved!
Unfortunately over here (UK) any good news linked to Mr Trump, in any conceivable way, is normally ignored by the MSM.
In fact he has replaced the late Mrs Margaret Thatcher or “that woman” as some like to say, as the new Anti-Christ.