America is rich. Per person, the US economy produces significantly more than most European economies do.
One could simply compare GDP per capita figures to show this, but there’s another, more interesting, method. Using recent rates of economic growth, it’s possible to calculate how long it would take for a poorer economy to become as rich as the richer economy is now.
Thanks to a new website, you can get the answer instantly. It’s the creation of Oliver W. Kim — an economics PhD student at Berkeley. Called The Mountain to Climb, it allows to the user to compare any two countries.
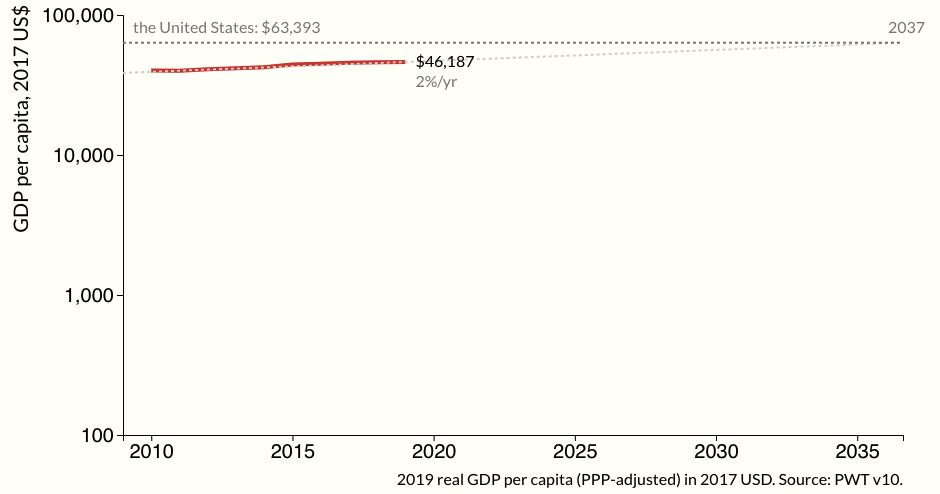
For instance, compared to American GDP per capita in 2019, the British economy won’t reach the same level until 2037. So, on this measure, the UK is 18 years behind the US.
Red line denotes the United Kingdom
There’s an extensive economic literature as to why such a wide gap exists between America and the UK and other European countries. One of the most basic reasons is that Americans work harder — or at least longer. Innovation and entrepreneurship is perhaps the biggest factor, which is reflected in the fact that Big Tech in the West is dominated by American firms.
Natural resource endowments can make a difference too. For instance, Europe is currently reeling under the impact of the surging energy cost, but the US is partially protected by its shale gas resources.
Of course, the differences between the US and Europe pale into insignificance compared to those between the West as a whole and the world’s poorest nations. Kim calculates that it would take “over 300 years”…
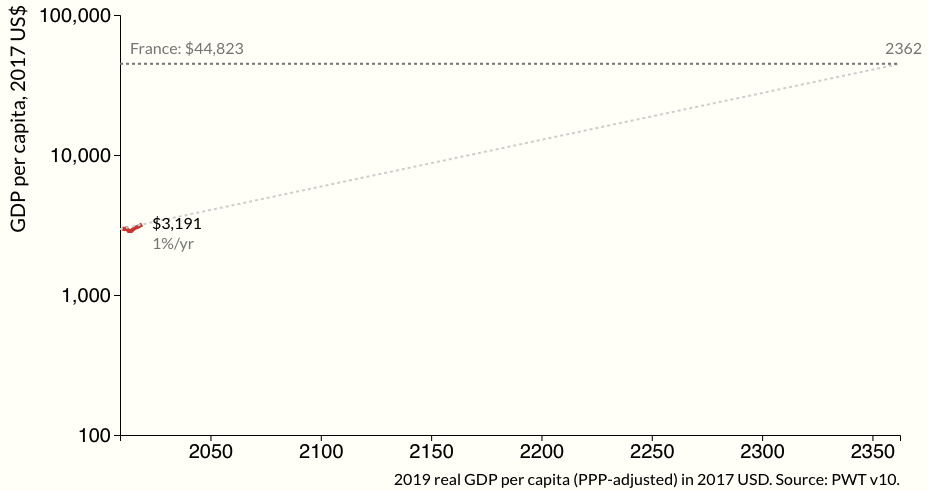
Kim uses this method to illustrate the huge gap between the richest and poorest in the world. For instance, he points out that it would take “over 300 years” for the West African country of Guinea-Bissau to “reach the 2019 GDP per capita of its former colonizer Portugal.” In the case of Senegal and France, the equivalent figure is 2,572 years.
However, the mountain to climb isn’t as high everywhere in the developing world. Using recent ten-year growth rates, it will take Bangladesh 32 years to get to where Britain is now. The corresponding figure for Indonesia and the Netherlands is also 32 years.
Red line denotes Senegal
It’s been a while since the term “third world” fell out of favour, to be replaced by “developing world”. But for how long will it make sense to refer to countries like Bangladesh as “developing” if, in a generation or so, they become as rich as we are now?
Of course, there are various caveats which Kim is careful to point out. Most importantly, these are projections based on current or historical growth rates; they are not predictions. Rates of growth change over time. Furthermore, GDP per capita is a crude average that says nothing about how equally income is distributed.
Nor is GDP the only measure of national well-being. For instance, Britain may be poorer than America, but Brits may place a greater value on universal healthcare, walkable cities, longer holidays and the abundance of their cultural heritage.
Furthermore, countries playing catch-up can often leapfrog entire stages of development that richer countries had to go through. A key example is communications technology. Today, nations can go straight to the digital, mobile stage without the analogue, fixed-line stage.
So while GDP comparisons do expose global inequalities, many of them extreme, the potential for rapid improvement also exists.
Peter Franklin is Associate Editor of UnHerd. He was previously a policy advisor and speechwriter on environmental and social issues.
GDP is a concept of the total country. It would be more interesting to show the range of riches within any country. I suspect that the USA has a very extreme range compared to semi-socialist countries.
The median salaries in the UK and US are remarkably similar. Converted to US$, the UK it is $32,739 and the US is $34,248. When you take into account the extra annual leave, sick pay, maternity pay, employment protections etc that UK enjoys, as well as free point of use healthcare I’d say the UK is a much better place for the average worker. America may be richer in terms of GDP per capita, but that wealth is spread very unevenly, disgustingly so in my opinion
Tapani Simojoki
2 years ago
The late Hans Rosling gave a much better comparative framework: 4 levels of wealth. My hunch would be that Bangladesh is pushing into – or possibly already at – Level 3: a lot closer to Level 4 (UK) than Level 1 (South Sudan)
Interesting is how Bangladesh stopped Delta covid by doing as Trump recommended, using nasal/oral wash ( to reduce viral load as recommended by Dr McCullough), as well as Ivermectin and Hydroxychloroquine, but it will be a long time before they recover from their Lockdowns in the economy.
Except it hasn’t. Bangladesh’s low Covid deaths are largely down to two reasons. Firstly a lack of testing capacity means many deaths, especially in poorer rural areas, go unreported which leads to figure being lower than they really are, as opposed to the UK in which deaths have been vastly inflated in my opinion. Secondly Bangladesh is a relatively young country with a median age of 27, as opposed to over 40 in most western nations. As Covid disproportionately kills the elderly this would also explain the lower fatality rate. These two reasons are also why cases and deaths are also lower in India and much of Africa
Agreed. He really shows up the shallow nature of policy makers knowledge in the past and that of the general population as a result of MSM misinformation.
Jon Hawksley
2 years ago
The article does not mention the exchange rates used in calculating future GDPs. Current disparities can be misleading if the local purchasing power is different from market rates.
Galeti Tavas
2 years ago
In the West about 50% of working age are net income tax payers, so each tax payer has to be carrying most of a non-net tax payer on their backs as they go about doing their daily grind.
This is going to reach a critical point soon enough, as automation, AI Programs, and Welfare families increase wile the productive pretty much quit having families. Not only are the demographics of the West – but China as well, becoming skewed to the older end, and it is the married, child having, working, demographic, which both produces and consumes the GDP into producing wealth.
The 28 year old, social science, or Arts, university graduate Drone with massive university debt and feckless lifestyle, childless and working as a Barista, to never have a family, own a house, or build up the nation, become the generation which will have to carry the future, the West is doomed.


Join the discussion
Join like minded readers that support our journalism by becoming a paid subscriber
To join the discussion in the comments, become a paid subscriber.
Join like minded readers that support our journalism, read unlimited articles and enjoy other subscriber-only benefits.
SubscribeGDP is a concept of the total country. It would be more interesting to show the range of riches within any country. I suspect that the USA has a very extreme range compared to semi-socialist countries.
The median salaries in the UK and US are remarkably similar. Converted to US$, the UK it is $32,739 and the US is $34,248. When you take into account the extra annual leave, sick pay, maternity pay, employment protections etc that UK enjoys, as well as free point of use healthcare I’d say the UK is a much better place for the average worker. America may be richer in terms of GDP per capita, but that wealth is spread very unevenly, disgustingly so in my opinion
The late Hans Rosling gave a much better comparative framework: 4 levels of wealth. My hunch would be that Bangladesh is pushing into – or possibly already at – Level 3: a lot closer to Level 4 (UK) than Level 1 (South Sudan)
not if you are Rohingya
Interesting is how Bangladesh stopped Delta covid by doing as Trump recommended, using nasal/oral wash ( to reduce viral load as recommended by Dr McCullough), as well as Ivermectin and Hydroxychloroquine, but it will be a long time before they recover from their Lockdowns in the economy.
Except it hasn’t. Bangladesh’s low Covid deaths are largely down to two reasons. Firstly a lack of testing capacity means many deaths, especially in poorer rural areas, go unreported which leads to figure being lower than they really are, as opposed to the UK in which deaths have been vastly inflated in my opinion. Secondly Bangladesh is a relatively young country with a median age of 27, as opposed to over 40 in most western nations. As Covid disproportionately kills the elderly this would also explain the lower fatality rate. These two reasons are also why cases and deaths are also lower in India and much of Africa
Yes, you only need to have a quick look it the Charts in Factfulness to see the calculations advanced here are not to be taken too seriously.
Agreed. Factfulness is a brilliant book, one that ought to be required reading for every policymaker on the planet, in my opinion.
Agreed. He really shows up the shallow nature of policy makers knowledge in the past and that of the general population as a result of MSM misinformation.
The article does not mention the exchange rates used in calculating future GDPs. Current disparities can be misleading if the local purchasing power is different from market rates.
In the West about 50% of working age are net income tax payers, so each tax payer has to be carrying most of a non-net tax payer on their backs as they go about doing their daily grind.
This is going to reach a critical point soon enough, as automation, AI Programs, and Welfare families increase wile the productive pretty much quit having families. Not only are the demographics of the West – but China as well, becoming skewed to the older end, and it is the married, child having, working, demographic, which both produces and consumes the GDP into producing wealth.
The 28 year old, social science, or Arts, university graduate Drone with massive university debt and feckless lifestyle, childless and working as a Barista, to never have a family, own a house, or build up the nation, become the generation which will have to carry the future, the West is doomed.